Topic: Heat Of Reaction Amd Potential Energy Diagram
Heat Of Reaction Amd Potential Energy Diagram
Which potential energy diagram represents the change in potential energy that occurs when a catalyst is added to a chemical reaction?

(1) 
(2) 
(3) 
(4) 
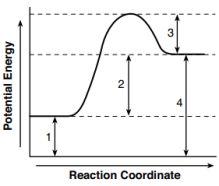
Given the potential energy diagram for a reaction:

Which intervals are affected by the addition of a catalyst?
(1) 1 and 2
(2) 1 and 3
(3) 2 and 4
(4) 3 and 4
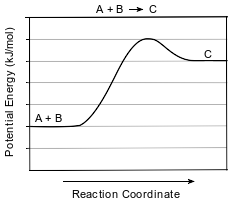
Given the equation and potential energy diagram representing a reaction:

If each interval on the axis labeled “Potential Energy (kJ/mol)” represents 10. kJ/mol, what is the heat of reaction?
(1) +60. kJ/mol
(2) +20. kJ/mol
(3) +30. kJ/mol
(4) +40. kJ/mol
The energy absorbed and the energy released during a chemical reaction are best represented by a
(1) cooling curve
(2) heating curve
(3) kinetic energy diagram
(4) potential energy diagram
Given the potential energy diagram representing a reversible reaction:

The activation energy for the reverse reaction is represented by
(1) A + B
(2) B + C
(3) B + D
(4) C + D
Given the potential energy diagram for a chemical reaction:

Which numbered interval represents the heat of reaction?
(1) 1
(2) 2
(3) 3
(4) 4
Which diagram represents the potential energy changes during an exothermic reaction?
(1) 
(2) 
(3) 
(4) 
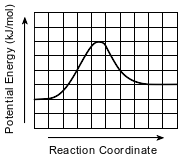
Given the potential energy diagram for a reversible chemical reaction:

Each interval on the axis labeled “Potential Energy (kJ/mol)” represents 10. kilojoules per mole. What is the activation energy of the forward reaction?
(1) 10. kJ/mol
(2) 30. kJ/mol
(3) 40. kJ/mol
(4) 60. kJ/mol
Given the potential energy diagram representing a reaction:

Which numbered interval represents the heat of reaction?
(1) 1
(2) 2
(3) 3
(4) 4
The equation below represents an equilibrium system of SO2(g), O2(g), and SO3(g). The reaction can be catalyzed by vanadium or platinum.
2SO2(g) + O2(g) ⇌ 2SO3(g) + energy
A potential energy diagram for the forward reaction is shown below. On this diagram, draw a dashed line to show how the potential energy changes when the reaction occurs by the catalyzed pathway.

Allow 1 credit.
• Example of a 1-credit response:
• chem62015-rg_g1.png
The balanced equation below represents the reaction between carbon monoxide and oxygen to produce carbon dioxide.
2CO(g) + O2(g) → 2CO2(g) + energy
On the potential energy diagram below, draw a dashed line to show how the potential energy diagram changes when the reaction is catalyzed.

Allow 1 credit.
• Examples of 1-credit responses:
• chem82018-rg_g7.png
The potential energy diagram and balanced equation shown below represent a reaction between solid carbon and hydrogen gas to produce 1 mole of C2H4(g) at 101.3 kPa and 298 K.

State what interval 3 represents.
Allow 1 credit. Acceptable responses include, but are not limited to:
• Interval 3 represents the difference in potential energy between the products and the reactants.
• Interval 3 represents the heat of reaction, +52.4 kJ.
• ∆H
Carbon monoxide, CO(g), is a toxic gas found in automobile exhaust. The concentration of CO(g) can be decreased by using a catalyst in the reaction between CO(g) and O2(g). This reaction is represented by the balanced equation below.

On the labeled axes in your answer booklet, draw the potential energy curve for the reaction represented by this equation.
Allow 1 credit for showing that the potential energy of the products is lower than the potential
• energy of the reactants.
• Example of a 1-credit response:
• chem12017-rg_g7.png
The balanced equation below represents the reaction between a 5.0-gram sample of zinc metal and a 0.5 M solution of hydrochloric acid. The reaction takes place in an open test tube at 298 K and 1 atm in a laboratory activity.
Zn(s) + 2HCl(aq) → H2(g) + ZnCl2(aq) + energy
On the labeled axes in your answer booklet, draw a potential energy diagram for this reaction.
Allow 1 credit for showing that the PE of the products is lower than the PE of the reactants.
• Example of a 1-credit response:
One process used to manufacture sulfuric acid is called the contact process. One step in this process, the reaction between sulfur dioxide and oxygen, is represented by the forward reaction in the system at equilibrium shown below.
2SO2(g) + O2(g) ⇌ 2SO3(g) + 394 kJ
A mixture of platinum and vanadium(V) oxide may be used as a catalyst for this reaction. The sulfur trioxide produced is then used to make sulfuric acid.
On the labeled axes in your answer booklet, complete the potential energy diagram for the forward reaction represented by this equation.
Allow 1 credit.
• Example of a 1-credit response:
