
Topic: Air Mass
Air Mass
The map below shows a cold, arctic air mass that moved southeast from Canada to cover most of the eastern half of the United States during January 2010.
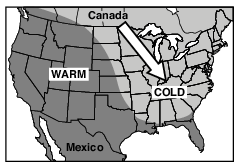
Which shift caused this flow of cold air out of Canada?
(1) the northward shift of the global temperature zones
(2) the northward shift of the Sun’s vertical rays
(3) a southward shift of the polar front jet stream
(4) a southward shift of the subtropical jet stream
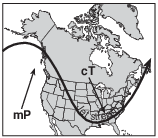
An air mass entering Alaska from the northern Pacific Ocean would most likely be labeled on a weather map as
(1) cP
(2) cT
(3) mP
(4) mT
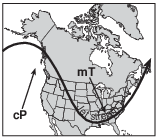
The map of North America below shows the source region of an air mass forming mostly over Mexico.

This air mass originating over Mexico is classified as
(1) continental polar
(2) continental tropical
(3) maritime polar
(4) maritime tropical
The map below shows a position of the polar jet stream over North America in January.
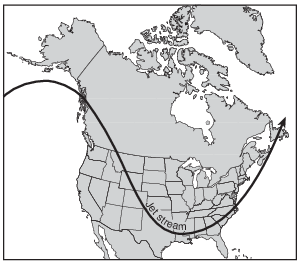
Which map best shows the air-mass movements associated with this jet stream position?
(1) 
(2) 
(3) 
(4) 
Which cross section correctly represents a cold front and the air-mass movements associated with this front?
(1) 
(2) 
(3) 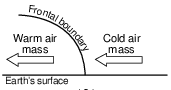
(4) 
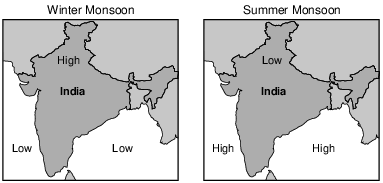
Which two-letter symbol represents the most likely air mass formed over portions of the Indian Ocean shown on the maps?
(1) mP
(2) mT
(3) cP
(4) cT
Which statement best describes the difference in air temperature and humidity between the cP and mT air masses?
(1) The mT air mass is warmer and more humid.
(2) The mT air mass is cooler and less humid.
(3) The cP air mass is warmer and less humid.
(4) The cP air mass is cooler and more humid.
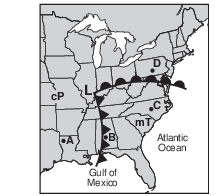
Which atmospheric conditions describe the air mass that is influencing weather conditions at location C?
(1) cool and dry
(2) cool and moist
(3) warm and dry
(4) warm and moist
Lake-Effect Snow
In late fall, cold air originating in Canada and then moving over the Great Lakes often produces lake-effect snow in New York State.
When the cold air mass moves across large areas of warmer lake water, water vapor enters the cold air. When this moist air moves over the cooler land, the moisture comes out of the atmosphere as snow. The effect is enhanced when the air that flows off the lake is forced over higher land elevations. The areas affected by lake-effect snow can receive many inches of snow per hour. As the lakes gradually freeze, the ability to produce lake-effect snow decreases.
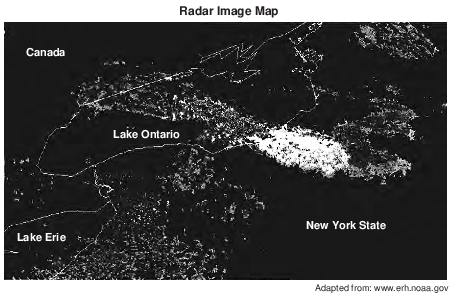
What is the most likely two-letter air mass symbol for an air mass from Canada that produces lake-effect snow in New York State?
(1) mT
(2) mP
(3) cT
(4) cP
Which type of air mass most likely has high humidity and high temperature?
(1) cP
(2) cT
(3) mT
(4) mP
One air mass associated with this pressure system originally formed over the Gulf of Mexico. Write the two-letter weather map symbol for this type of air mass. [1]
______________
Allow 1 credit for mT. Allow credit for either uppercase or lowercase letters.
• Note: Do not allow credit if air-mass letters are reversed, such as Tm or TM.
• For students who used the Spanish edition, either exclusively or in conjunction with the. English edition of the exam, allow credit for the correct two-letter air-mass symbol as it appears in either the English or Spanish 2011 Edition Reference Tables for Physical. Setting/Earth Science.

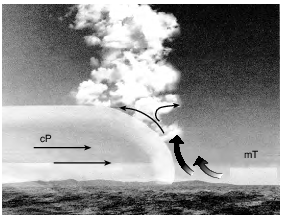
An air mass acquires the characteristics of the surface over which it forms. In image below, circle the type of Earth surface (land or ocean) and describe the relative temperature of the surface over which the mT air mass most likely formed. [1]
Circle one: land ocean Relative temperature of Earth’s surface:
Allow 1 credit for circling ocean and correctly describing the relative temperature of Earth’s surface. Acceptable descriptions include, but are not limited to:
• — warmer
• — hot
• — a tropical temperature
• Note: Do not allow credit for a numerical answer because there are no temperatures indicated for
• comparison.

Describe the change in air pressure that will most likely occur at Rochester by the time that the cold front has reached Syracuse. Then describe what will most likely happen to the amount of cloud cover in Rochester with this change in air pressure and location of the cold front. [1]
Change in air pressure: Amount of cloud cover:
Allow 1 credit if both responses are correct. Acceptable responses include, but are not limited to:
• Change in air pressure:
• — slight decrease, then a steady increase
• — generally increasing/rising
• — lower to higher
• — greater
• Amount of cloud cover:
• — It decreased.
• — lower percent
• — clear/0%
• — There are fewer clouds.
• — little cloud cover
Write the two-letter weather map symbol for the type of air mass that is most likely located north of frontal boundary AB. [1]
Allow 1 credit for cP or cA or mP. Allow credit for either uppercase or lowercase letters.
• Note: Do not allow credit if air-mass letters are reversed, such as Ac or Pc.
• For students who used the Spanish edition, either exclusively or in conjunction with the. English edition of the exam, allow credit for the correct two-letter air-mass symbol as it appears in either the English or Spanish 2011 Edition Reference Tables for Physical Setting/. Earth Science.
Nor’easters
A nor’easter is a large, low-pressure storm system that moves along the east coast of the United States. The wind over the land blows generally from the northeast as the center of the low passes by a location, hence the name nor’easter. Due to the circulation of winds around the center of the low-pressure system, large amounts of precipitation occur as moist air is carried from the ocean to the land. These storms usually intensify off of the North Carolina coast as they track toward the northeast.
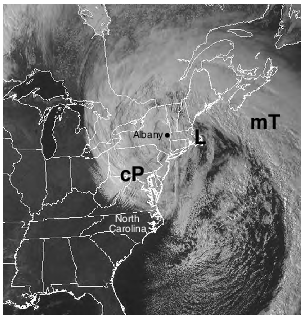
Circle the terms that best describe the relative moisture and relative temperature characteristics of the mT air mass compared to the cP air mass shown on the map. [1]
Relative moisture of mT air mass (circle one): more humid less humid the same Relative temperature of mT air mass (circle one): cooler warmer the same
Allow 1 credit for circling both more humid and warmer.