
Topic: Climate Of A Location
Climate Of A Location
Which surface ocean current cools the climate of the western coastline of South America?
(1) Brazil Current
(2) Peru Current
(3) Falkland Current
(4) California Current
The Gulf Stream and North Atlantic Current modify the climate of northwestern Europe by making the climate
(1) warmer and drier
(2) warmer and more humid
(3) cooler and drier
(4) cooler and more humid
The cross section below shows two cities, A and B, at different elevations.

Compared to the yearly temperature and precipitation at city B, city A most likely has
(1) lower temperatures and less precipitation
(2) lower temperatures and more precipitation
(3) higher temperatures and less precipitation
(4) higher temperatures and more precipitation
A city located on the coast of North America has warmer winters and cooler summers than a city at the same elevation and latitude located near the center of North America. Which statement best explains the difference between the climates of the two cities?
(1) Ocean surfaces change temperature more slowly than land surfaces.
(2) Warm, moist air rises when it meets cool, dry air.
(3) Wind speeds are usually greater over land than over ocean water.
(4) Water has a lower specific heat than land.
The arrows on the map below show the prevailing winds at a midlatitude coastal city.
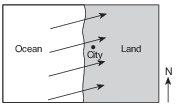
This city most likely has a climate that is
(1) arid, with a small difference between the highest and lowest yearly temperatures
(2) arid, with a large difference between the highest and lowest yearly temperatures
(3) humid, with a small difference between the highest and lowest yearly temperatures
(4) humid, with a large difference between the highest and lowest yearly temperatures
The photograph below shows Mt. Kilimanjaro, a volcano in Africa, located near the equator.

Which climate factor is responsible for the snow seen on Mt. Kilimanjaro?
(1) high latitude
(2) high elevation
(3) nearness to a cold ocean current
(4) nearness to a high-pressure weather center
The cross section below represents a prevailing wind flow that causes different climates on the windward and leeward sides of a mountain range.

Compared to the temperature and moisture of the air rising on the windward side, the temperature and moisture of the air descending at the same altitude on the leeward side will be
(1) warmer and drier
(2) warmer and more moist
(3) cooler and drier
(4) cooler and more moist
Riverhead, New York, has a smaller average daily temperature range than Elmira, New York, because Riverhead is located
(1) near a large body of water
(2) at a lower latitude
(3) at a higher elevation
(4) near a large city
The graph below shows the yearly air temperature and precipitation of a location on Earth.
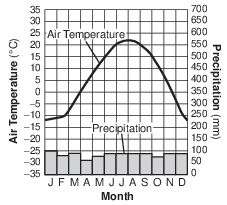
This location would be most likely at a latitude of
(1) 0°
(2) 35° S
(3) 50° N
(4) 90° N
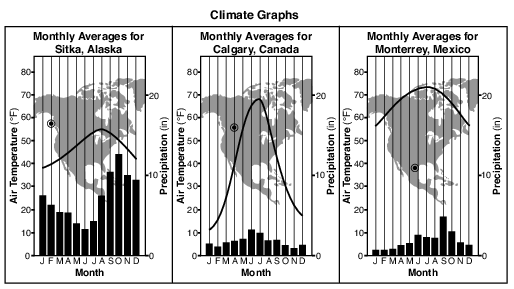
State one reason why the annual temperature range of Calgary, Canada, is greater than the annual temperature range in Sitka, Alaska. [1]
Allow 1 credit. Acceptable responses include, but are not limited to:
• — Calgary is surrounded by land, which has a lower specific heat than water.
• — Sitka is located near a large body of water, which has a higher specific heat than land
• materials.
• — The large body of water near Sitka moderates the temperature.
• — Calgary has a continental climate, while Sitka has a maritime climate.
• — Calgary is farther inland.
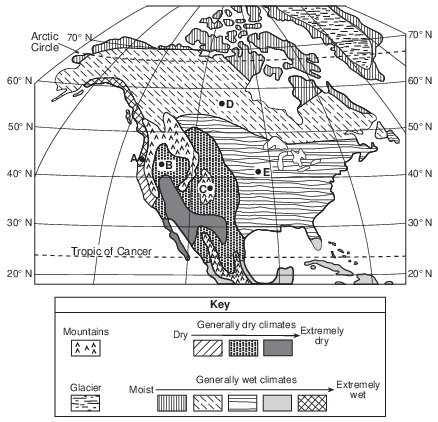
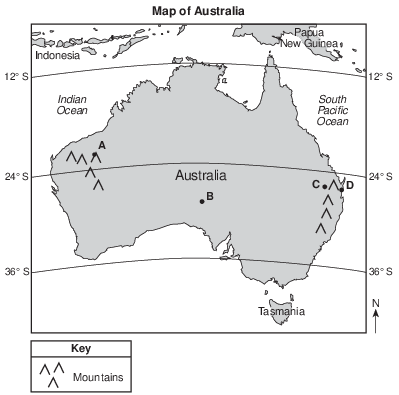
Explain why the climate at location A is more moist than the climate at location B. [1]
Allow 1 credit. Acceptable responses include, but are not limited to:
• — Location A is on the windward side of mountains.
• — Location A receives prevailing winds off the ocean.
• — Location A is closer to the ocean.
• — Location B is on the leeward side of a mountain range.
• — Adiabatic warming occurs in descending air at location B after losing most of its moisture
• on the windward side of a mountain/orographic effect.
• — The prevailing southwest winds bring moist air to location A.
Identify the primary factor that causes location C to have a colder climate than location D. [1]
Allow 1 credit. Acceptable responses include, but are not limited to:
• — elevation
• — altitude
• — height above sea level
• — Location C is on the top of a mountain.
• — Location D is at a lower elevation.
• — C is located in the mountains.
The average annual air temperature at location A is approximately 77°F, while the average annual air temperature at location B is approximately 55°F. Explain why location B has cooler average temperatures. [1]
Allow 1 credit. Acceptable responses include, but are not limited to:
• — B is higher in elevation.
• — Higher elevations have cooler temperatures.
• — B is in the mountains.

Calculate the rate of change in the average monthly temperature for Omaha during the two-month period between October and December, as shown on the graph. [1]
C°/month
Allow 1 credit for 8C°/month or −8C°/mo.
Explain why location A has a cooler average yearly air temperature than location B. [1]
Allow 1 credit. Acceptable responses include, but are not limited to:
• — The higher elevation at A has a cooler temperature.
• — Location A is at a higher elevation.
• — Location A is in the mountains.
• — Location B is not as high in elevation.