
Topic: Dewpoint Humidty Cloud Formation
Dewpoint Humidty Cloud Formation
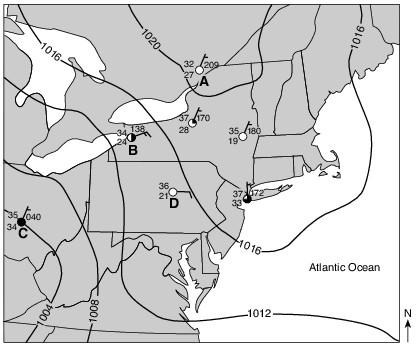
Which weather station had the highest relative humidity?
(1) A
(2) B
(3) C
(4) D
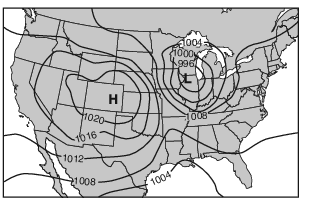
Which map shows the most likely location of clouds associated with these pressure centers?
(1) 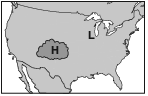
(2) 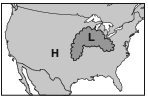
(3) 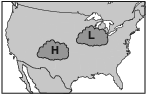
(4) 
A dry-bulb temperature of 30°C and a wet-bulb temperature of 29°C were recorded at a weather station. What are the relative humidity and the most likely weather conditions?
(1) Relative humidity is 29% with clear skies.
(2) Relative humidity is 29% with a good chance of snow.
(3) Relative humidity is 93% with clear skies.
(4) Relative humidity is 93% with a good chance of rain.
Which sequence of events affecting moist air within Earth’s atmosphere causes cloud formation?
(1) rising → expanding → cooling → condensation
(2) rising → contracting → warming → evaporation
(3) sinking → expanding → warming → condensation
(4) sinking → contracting → cooling → evaporation
What is the dewpoint when the dry-bulb temperature is 12°C and the wet-bulb temperature is 7°C?
(1) 1°C
(2) −5°C
(3) 28°C
(4) 48°C
Which weather instrument is most useful in measuring relative humidity?
(1) barometer
(2) anemometer
(3) psychrometer
(4) wind vane
If the air temperature is 20°C and the relative humidity is 58%, what is the dewpoint?
(1) 5°C
(2) 12°C
(3) 15°C
(4) 38°C
Clouds most likely form as a result of
(1) moist air rising, compressing, and warming
(2) moist air rising, expanding, and cooling
(3) dry air rising, compressing, and warming
(4) dry air rising, expanding, and cooling
The dewpoint is 15°C. What is the wet-bulb temperature on a sling psychrometer if the dry-bulb temperature is 18°C?
(1) 16°C
(2) 2°C
(3) 3°C
(4) 20°C
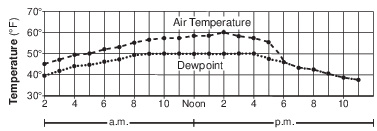
What was the relative humidity at 8:00 p.m.?
(1) 30%
(2) 45%
(3) 75%
(4) 100%
What is the relative humidity of the air when the dry-bulb temperature is 4°C and the dewpoint is −4°C?
(1) 42%
(2) 46%
(3) 51%
(4) 56%
Identify one weather instrument that could be used to determine the dewpoint of the air at point A. [1]
Allow 1 credit. Acceptable responses include, but are not limited to:
• — psychrometer
• — wet- and dry-bulb thermometer
• — hygrometer
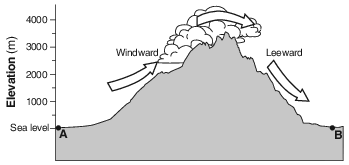
Identify one process that occurred in rising, moist air that caused the clouds to form at this location. [1]
Allow 1 credit. Acceptable responses include, but are not limited to:
• — expansion
• — condensation
• — cooling
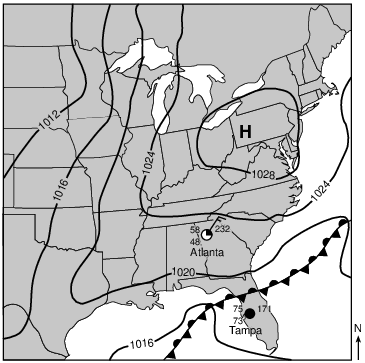
Describe one piece of evidence shown on the map that indicates that Tampa, Florida, has a high probability of precipitation. [1]
Allow 1 credit. Acceptable responses include, but are not limited to:
• — The dewpoint and air temperature are close together./high relative humidity
• — 100% cloud cover/overcast
• — Tampa is close to a front.
• — The air pressure is low.
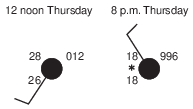
State the relative humidity at this location at 8 p.m. Thursday. [1]
in/h
Allow 1 credit for 100%.