Earth Science worksheet
    Topic: Eccentricity Rate Gradient Standard Error
    Eccentricity Rate Gradient Standard Error
    Base your answers to questions 1 on the diagram below and on your knowledge of Earth science. The diagram represents one position of Earth in its orbit around the Sun and 12 constellations that can be seen in the night sky by an observer in New York State at different times of the year. The approximate locations of the constellations in relation to Earth’s orbit are shown. Point A represents another position in Earth’s orbit.

    seasons-and-astronomy, earth-revolution, standard-6-interconnectedness, models fig: esci-v202-exam_g37.png

    1

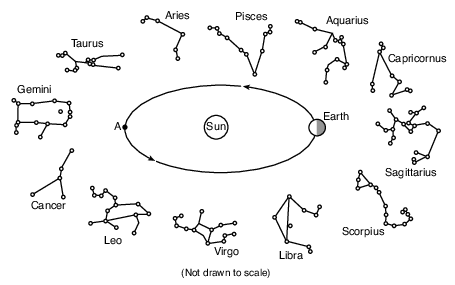
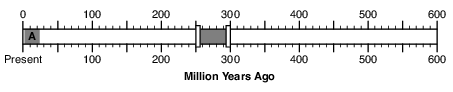
    Approximately how many days (d) does it take for Earth to orbit from its present position to point A?

    (1) 27 d

    (2) 91 d

    (3) 183 d

    (4) 365 d

    2

    Due to radioactive decay, an igneous rock sample now contains one-fourth of the amount of potassium-40 that it originally contained. The age, in years, of this rock sample is approximately

    (1) 0.7 109 y

    (2) 1.3 109 y

    (3) 2.6 109 y ×× ××

    (4) 5.2 109 y

    3

    What is the approximate density of a mineral with a mass of 262.2 grams that displaces 46 cubic centimeters of water?

    (1) 1.8 g/cm3

    (2) 5.7 g/cm3

    (3) 6.1 g/cm3

    (4) 12.2 g/cm3

    Base your answers to questions 4 on the time-exposure photograph shown below. The photograph was taken by aiming a camera at a portion of the night sky above a New York State location and leaving the camera’s shutter open for a period of time to record star trails.

    seasons-and-astronomy, earth-revolution, standard-1-math-and-science-inquery, geocentric-model-heliocentric-model, standard-6-interconnectedness, models fig: esci12012-examw_g34.png

    4

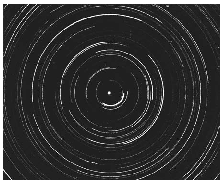
    During the time exposure of the photograph, the stars appear to have moved through an arc of 120°. How many hours did this time exposure take?

    (1) 5 h

    (2) 8 h

    (3) 12 h

    (4) 15 h

    Base your answers to questions 5 on the map in image provided, on the table below, and on your knowledge of Earth science. The map shows a portion of the Nazca Plate under the southeastern Pacific Ocean. Plate A represents another tectonic plate. The table shows some data for islands and seamounts (undersea volcanoes that do not rise above the ocean surface) that originally formed at the Easter Island Hot Spot.

    dynamic-earth, earth-surface-features, landscapes, standard-1-math-and-science-inquery, eccentricity-rate-gradient-standard-error, standard-6-interconnectedness, models fig: esci-v202-exam_g44.png

    5

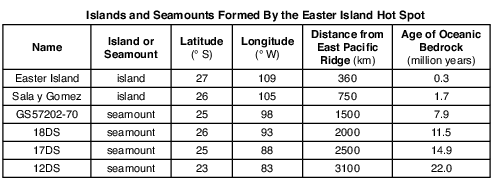
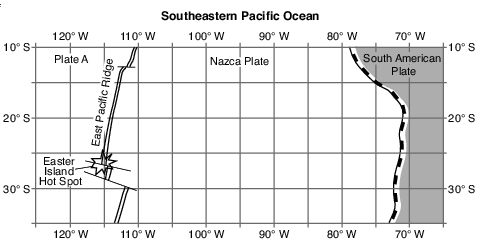
    On the map in the image provided, plot with Xs the locations of the six islands and seamounts formed by the Easter Island Hot Spot. [1]

    dynamic-earth, earth-surface-features, landscapes, standard-1-math-and-science-inquery, eccentricity-rate-gradient-standard-error, standard-6-interconnectedness, models fig: esci-v202-ansbk_abkq1.png

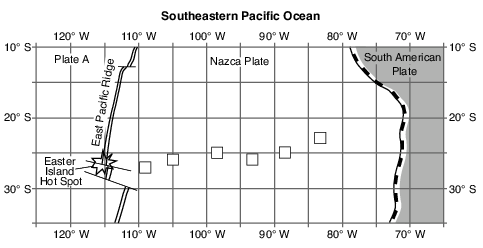
    Allow 1 credit if the centers of all six Xs are within or touch the clear boxes shown below.. Note: Allow credit if a symbol other than an X is used.

    • It is recommended that an overlay of the same scale as the student answer sheet be used to ensure reliability in rating.

    dynamic-earth, earth-surface-features, landscapes, standard-1-math-and-science-inquery, eccentricity-rate-gradient-standard-error, standard-6-interconnectedness, models fig: esci-v202-rg_g1.png

    Base your answers to questions 6 on the topographic map in image provided and on your knowledge of Earth science. Partially drawn contour lines are shown on the southern portion of the map. Points of elevation are recorded in meters. Points A, B, C, and D represent locations on Earth’s surface. Line AB and dashed line CD are reference lines.
    6

    On the grid in the image provided, construct a topographic profile along line AB by plotting the elevation of each contour line that crosses line AB. The elevations of points A and B have been plotted on the grid. Connect all nine plots with a line from A to B to complete the profile. [1]

    maps-and-measurement, topographic-maps, standard-1-math-and-science-inquery, eccentricity-rate-gradient-standard-error, standard-6-interconnectedness, models fig: esci-v202-ansbk_abkq5.png

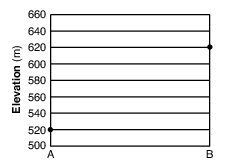
    Allow 1 credit if the centers of all seven student plots are within or touch the clear rectangles shown below and all nine plots are correctly connected with a line that passes within or touches the rectangles. The line must show the highest elevation above 640 m, but below 660 m.

    • Note: Allow credit if the line does not pass through the student’s plots, but is still within or

    • touches the rectangles.

    • It is recommended that an overlay of the same scale as the student answer sheet be used to ensure reliability in rating.

    maps-and-measurement, topographic-maps, standard-1-math-and-science-inquery, eccentricity-rate-gradient-standard-error, standard-6-interconnectedness, models fig: esci-v202-rg_g5.png

    Base your answers to questions 7 on the timeline in image provided and on your knowledge of Earth science. The timeline represents the last 600 million years of geologic time. Shaded area A represents the Neogene Period.
    7

    On the timeline in the image below, accurately shade in an area to represent the entire Permian Period. [1]

    geologic-history, reference-tables, earth-history, earth-history, geologic-time-units-and-the-events, standard-1-math-and-science-inquery, eccentricity-rate-gradient-standard-error, standard-1-math-and-science-inquery, changing-length-of-a-shadow-based-on-the-motion-of-the-sun fig: esci-v202-ansbk_abkq6.png

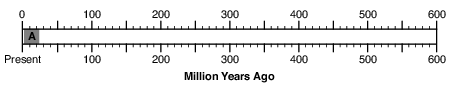
    Allow 1 credit for a shaded bar that begins and ends within or is touching the clear rectangles shown below.

    geologic-history, reference-tables, earth-history, earth-history, geologic-time-units-and-the-events, standard-1-math-and-science-inquery, eccentricity-rate-gradient-standard-error, standard-1-math-and-science-inquery, changing-length-of-a-shadow-based-on-the-motion-of-the-sun fig: esci-v202-rg_g6.png

    • Note: It is recommended that an overlay of the same scale as the student answer sheet be used

    • to ensure reliability in rating.

    Base your answers to questions 8 on the map in image provided, which shows elevations in feet at various points. The southern part of the map has contour lines representing elevations at 20-foot intervals. Lines AB and CD are reference lines on the map.
    8

    Calculate the gradient along line CD and label your answer with the correct units. [1]

    Gradient =

    Allow 1 credit for any value from 23 to 27 with the correct units. Acceptable units include, but are not limited to:

    • — feet/mile

    • — ft per mi

    Base your answers to questions 9 on the data table below, which shows the average carbon dioxide (CO2) concentrations in Earth’s atmosphere for specific years from 1930 to 2010. Carbon dioxide is a greenhouse gas in Earth’s atmosphere that contributes to global warming. The average carbon dioxide concentrations were measured in parts per million (ppm).

    climate, climate-alterd-by-natural-events-and-human-influences, standard-1-math-and-science-inquery, eccentricity-rate-gradient-standard-error fig: esci12013-exam_g42.png

    9

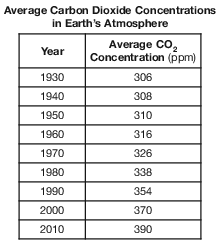
    On the grid in the image below, construct a line graph by plotting the average carbon dioxide concentrations in Earth’s atmosphere for each year shown on the data table. Connect the plots with a line. [1]

    climate, climate-alterd-by-natural-events-and-human-influences, standard-1-math-and-science-inquery, eccentricity-rate-gradient-standard-error fig: esci12013-ansbk_abkq4.png

    Allow 1 credit if all nine plots are within the circles shown below and are connected with a line that passes within the circles.

    • Note: It is recommended that an overlay of the same scale as the student answer booklet be used

    • to ensure reliability in rating.

    climate, climate-alterd-by-natural-events-and-human-influences, standard-1-math-and-science-inquery, eccentricity-rate-gradient-standard-error fig: esci12013-rg_g4.png

    Base your answers to questions 10 on the passage and data table below, which describe the exploration and characteristics of one of Saturn’s moons, Titan.

    Huygens Probe Lands on Titan

    The Huygens probe was carried to Saturn by the Cassini spacecraft and parachuted to the surface of Saturn’s giant moon, Titan. The Huygens probe’s landing site was littered with smooth, rounded, rocklike objects. Photographs taken of Titan’s surface show drainage channels leading to an apparent shoreline. The question is, what are they draining? One of the photographs seems to show ground fog consisting not of water, but perhaps of ethane or methane.

    landscapes, erosion-and-natural-agents-of-erosion, dynamic-earth, landforms, landscapes fig: esci12013-exam_g46.png

    10

    Approximately how many times farther is Titan from Saturn than Earth’s Moon is from Earth? [1]

    times farther

    Allow 1 credit for any value from 3.0 to 3.2 times farther.

    Base your answers to questions 11 on the data table and information below and on your knowledge of Earth science. The data table shows the radioactive decay of carbon-14 and the age of fossil remains, in years (y). Part of the table has been left blank.

    reference-tables, radioactive-decay-data, earth-history, earth-history, radioactive-isotopes-dating, standard-1-math-and-science-inquery, changing-length-of-a-shadow-based-on-the-motion-of-the-sun, standard-6-interconnectedness, models fig: esci12014-examw_g33.png

    11

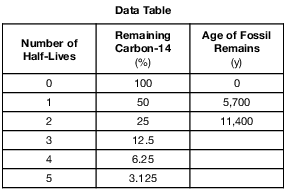
    The carbon-14 in the fossil remains of a mastodont has undergone five half-lives of radioactive decay. Calculate the age of these fossil remains. [1]

    y

    Allow 1 credit for 28,500 y.

    Base your answers to questions 12 on the passage and data table below and on your knowledge of Earth science. The data table shows the apparent hourly change in the direction of a pendulum’s swing, in degrees per hour (°/h), for six different Northern Hemisphere latitudes.

    Foucault’s Pendulum

    In 1851, Jean-Bernard-Léon Foucault attached a heavy iron ball to a steel wire hanging from the high ceiling of a church in Paris to demonstrate an apparent motion caused by Earth’s rotation. This pendulum could swing freely back and forth. A spike on the bottom of Foucault’s pendulum produced straight lines in sand spread on the floor. The position of each new line appeared to gradually shift in a clockwise direction. Eventually, the pendulum returned to its original path, completing a 360° pattern in approximately 32 hours. At other northern latitudes, a Foucault pendulum will complete a 360° pattern of swing in different amounts of time. In the Northern Hemisphere, the number of degrees that a pendulum appears to change its clockwise direction of swing each hour varies with latitude.

    seasons-and-astronomy, earth-rotation, standard-1-math-and-science-inquery, eccentricity-rate-gradient-standard-error, standard-6-interconnectedness, models fig: esci12015-examw_g55.png

    12

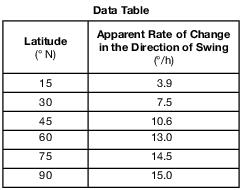
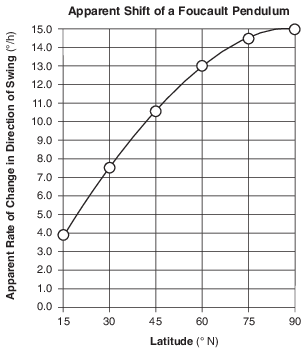
    On the grid in the image provided, plot the apparent rate of change in a Foucault pendulum’s direction of swing for each of the latitudes given in the data table. Connect the plots with a line. [1]

    seasons-and-astronomy, earth-rotation, standard-1-math-and-science-inquery, eccentricity-rate-gradient-standard-error, standard-6-interconnectedness, models fig: esci12015-ansbk_abkq8.png

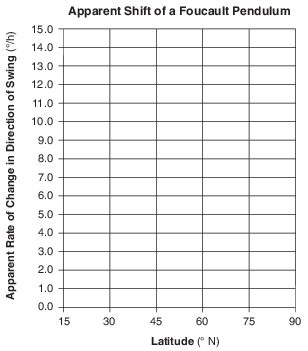
    Allow 1 credit if the centers of all six plots are within or touch the circles shown and the plots are correctly connected with a line that passes within or touches the circles.

    • Note: Allow credit if the student-drawn line does not pass through the student plots, but is still

    • within or touches the circles.. It is recommended that an overlay of the same scale as the student answer booklet be used to ensure reliability in rating.

    seasons-and-astronomy, earth-rotation, standard-1-math-and-science-inquery, eccentricity-rate-gradient-standard-error, standard-6-interconnectedness, models fig: esci12015-rg_g6.png

    Base your answers to questions 13 on the Characteristics of Stars graph in image provided and on your knowledge of Earth science.
    13

    The star Canopus has a surface temperature of 7400 K and a luminosity (relative to the Sun) of 1413. In your answer booklet, use an X to plot the position of Canopus on the graph, based on its surface temperature and luminosity. [1]

    reference-tables, characteristics-of-stars, seasons-and-astronomy, stars, standard-1-math-and-science-inquery, eccentricity-rate-gradient-standard-error, standard-1-math-and-science-inquery, changing-length-of-a-shadow-based-on-the-motion-of-the-sun, standard-6-interconnectedness, models fig: esci12015-ansbk_abkq9.png

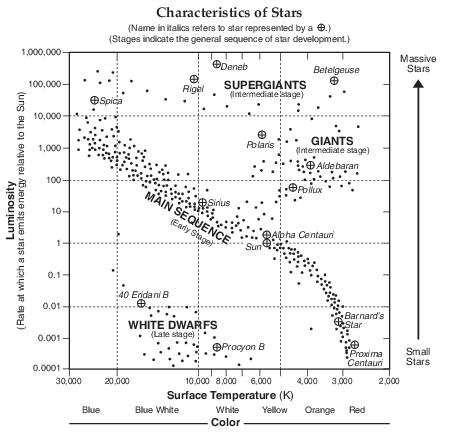
    Allow 1 credit if the center of the X is placed within or touches the box shown below.

    • Note: Allow credit if a symbol other than an X is used.

    • It is recommended that an overlay of the same scale as the student answer booklet be used to ensure reliability in rating.

    reference-tables, characteristics-of-stars, seasons-and-astronomy, stars, standard-1-math-and-science-inquery, eccentricity-rate-gradient-standard-error, standard-1-math-and-science-inquery, changing-length-of-a-shadow-based-on-the-motion-of-the-sun, standard-6-interconnectedness, models fig: esci12015-rg_g8.png

    Base your answers to questions 14 on the table below, on the map in image provided, and on your knowledge of Earth science. The table lists the latitude, longitude, and barometric pressure, in millibars (mb), of the center of a low-pressure system (L) as it moved across North America from March 14 to March 17. The map in image provided shows the center of this low-pressure system (L) and associated fronts on March 14. The location of the low-pressure system 24 hours later on March 15 is also indicated.

    meteorology, presentation-of-weather-data, standard-1-math-and-science-inquery, eccentricity-rate-gradient-standard-error, standard-6-interconnectedness, models fig: esci12015-examw_g57.png

    14

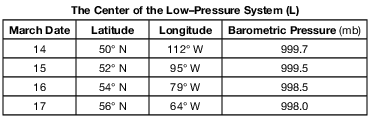
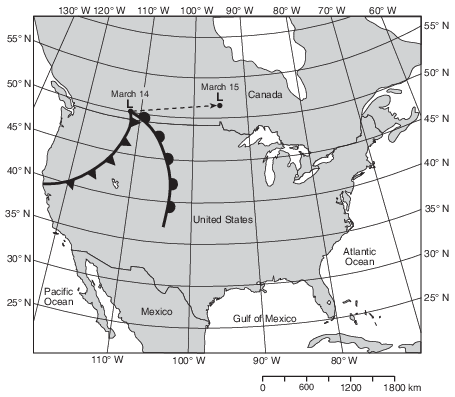
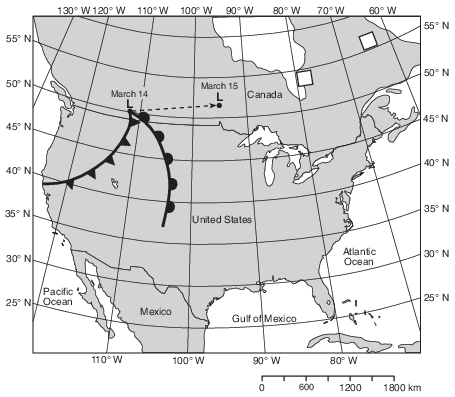
    On the map in the image provided, use the latitudes and longitudes listed in the data table to plot the March 16 and March 17 locations of the center of the low-pressure system (L) by placing an X at each location. [1]

    meteorology, presentation-of-weather-data, standard-1-math-and-science-inquery, eccentricity-rate-gradient-standard-error, standard-6-interconnectedness, models fig: esci12015-ansbk_abkq11.png

    Allow 1 credit if the centers of the two Xs fall within or touch the two empty boxes shown below.

    • Note: Allow credit if a symbol other than an X is used.

    • It is recommended that an overlay of the same scale as the student answer booklet be used to ensure reliability in rating.

    meteorology, presentation-of-weather-data, standard-1-math-and-science-inquery, eccentricity-rate-gradient-standard-error, standard-6-interconnectedness, models fig: esci12015-rg_g10.png

    Base your answers to questions 15 on the data table below and on your knowledge of Earth science. The table shows the distances from Earth to the Moon for certain days during December 2010. The percent of the Moon illuminated by the Sun as seen from Earth is also given.

    seasons-and-astronomy, motion-of-objects-in-the-solar-system, seasons-and-astronomy, the-solar-system, standard-1-math-and-science-inquery, eccentricity-rate-gradient-standard-error fig: esci12016-examw_g44.png

    15

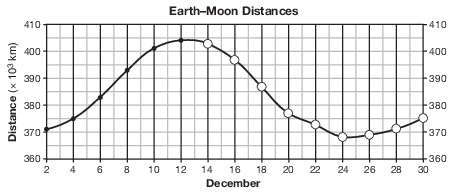
    On the grid in the image provided, the Earth–Moon distance data from December 2 to December 12 have already been plotted. Complete the line graph by plotting the Earth–Moon distances from December 14 to December 30. Continue the line from December 12 through all nine of your plotted points. [1]

    seasons-and-astronomy, motion-of-objects-in-the-solar-system, seasons-and-astronomy, the-solar-system, standard-1-math-and-science-inquery, eccentricity-rate-gradient-standard-error fig: esci12016-ansbk_abkq2.png

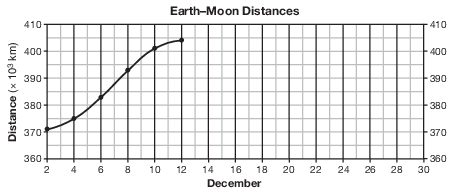
    Allow 1 credit if the centers of all nine of the student’s plots are within or touch the circles shown and all 15 plots are correctly connected with a line that passes within or touches each circle.

    • Note: Allow credit if the line misses a plot but is still within or touches the circle.

    • It is recommended that an overlay of the same scale as the student answer booklet be used to ensure reliability in rating.

    seasons-and-astronomy, motion-of-objects-in-the-solar-system, seasons-and-astronomy, the-solar-system, standard-1-math-and-science-inquery, eccentricity-rate-gradient-standard-error fig: esci12016-rg_g2.png