What is the approximate density of a mineral with a mass of 262.2 grams that displaces 46 cubic centimeters of water?
(1) 1.8 g/cm3
(2) 5.7 g/cm3
(3) 6.1 g/cm3
(4) 12.2 g/cm3
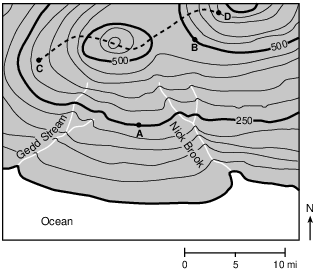
Base your answers to questions 2 on the topographic map below and on your knowledge of Earth science. Points A, B, C, and D represent locations on the surface of Earth. Elevations are measured in feet.
2
What is the approximate gradient from point A to point B on the map?
(1) 25 feet per mile
(2) 50 feet per mile
(3) 75 feet per mile
(4) 100 feet per mile
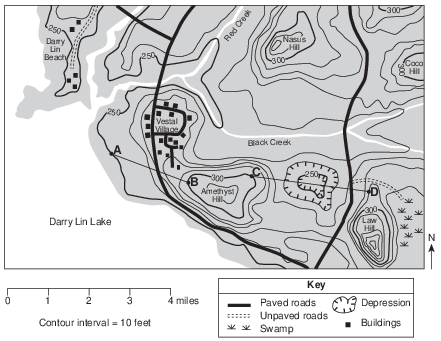
Base your answers to questions 3 on the topographic map below and on your knowledge of Earth science. On the map, points A, B, C, and D represent surface locations. The dashed line between points C and D represents a hiking trail. Elevations are in feet (ft).
3
The gradient between location A and location B is approximately
(1) 0.04 ft/mi
(2) 25 ft/mi
(3) 40 ft/mi
(4) 50 ft/mi
4
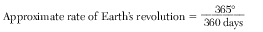
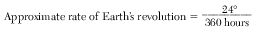
Which equation is used to determine the approximate rate of Earth’s revolution?
(1)
(2)
(3)
(4)
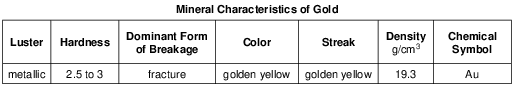
Base your answers to questions 5 on the passage, two diagrams, and table below and on your knowledge of Earth science. The passage describes a method used to mine gold and the diagrams represent two different views of a sluice box, which is used to separate gold from other sediments. The table shows the mineral characteristics of gold.
Gold Mining
A sluice box is used to remove gold pieces from other sediments in a stream. The box is placed in the stream to channel some of the water flow. Gold-bearing sediment is placed at the upper end of the box. The riffles in the bottom of the box are designed and positioned to create disruptions in the water flow. These disruptions cause dead zones in the current that allow the more dense gold to drop out of suspension and be deposited behind the riffles. Lighter material flows out of the box as tailings. Typically, particles of the mineral pyrite, which shares characteristics with gold, are deposited with gold particles in the sluice box. Since miners were fooled into thinking the nuggets of pyrite were gold, the name “fool’s gold” is often applied to pyrite.
5
A gold nugget with a volume of 0.8 cubic centimeter (cm3) was found in the sluice box. Calculate the mass of this gold nugget. [1]
______________ g
Allow 1 credit for 15.44 g or 15.4 g or 15 g.
Base your answers to questions 6 on the snowfall map of the Tug Hill Plateau region of New York State in image provided and on your knowledge of Earth science. A lake-effect snowstorm occurred on November 16–19, 2008. Snow depths are indicated in inches at several points and by two labeled isolines. Dashed line AB is a reference line on the map between two recorded snow depths.
6
Calculate the snow depth gradient between point A and point B, in inches per mile. [1]
in/mi
Allow 1 credit for any response from 0.75 in/mi to 0.85 in/mi.
• Note: Do not allow credit for 20/25 because this does not show a complete calculation.
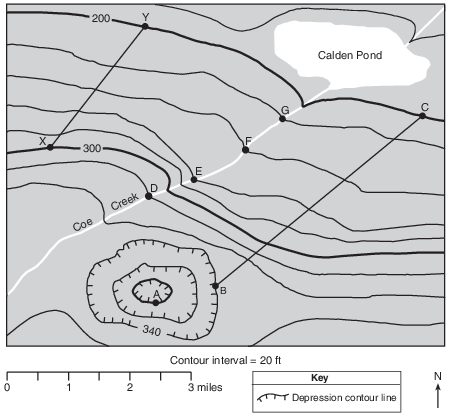
Base your answers to questions 7 on the topographic map below and on your knowledge of Earth science. Point A represents a location on Earth’s surface. Lines BC and XY are reference lines on the map. Points D, E, F, and G represent locations along Coe Creek. Elevations are shown in feet.
7
Calculate the gradient along line XY. Label your answer with the correct units. [1]
Allow 1 credit for any value from 38 to 42 with acceptable units. Acceptable units include, but are not limited to:
• — ft/mi
• — feet/mi
• — feet/mile
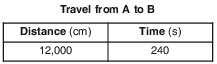
Base your answers to questions 8 on the map in image provided, which represents two bridges that cross the Green River. Letters A, B, and C represent locations in the river. A ball was dropped from bridge 1 at location A and the distance and travel time to location B were recorded. The results are shown in the data table below.
8
Determine the rate at which the ball traveled, in centimeters per second, from location A to location B. [1]
cm/s
Allow 1 credit for 50 cm/s.
Base your answers to questions 9 on the topographic map in the image provided and on your knowledge of Earth science. Some contour lines have been drawn. Line AB is a reference line on the map.
9
Calculate the gradient along the reference line from A to B, in meters per kilometer. [1]
Gradient =
Allow 1 credit for any value from 22 m/km to 29 m/km.
Base your answers to questions 10 on the map in image provided and on your knowledge of Earth science. The map shows the total amount of snowfall, measured in inches, from a lake-effect snow storm that affected western New York from November 17 through November 21, 2014. The 20-inch and 40-inch snowfall isolines have been drawn. Niagara Falls and Cowlesville are labeled on the map.
10
Cowlesville, New York, received a total of 88 inches of snow in 85 hours. Calculate the average rate of snowfall in inches per hour (in/h) for Cowlesville. [1]
______________ in/h
Allow 1 credit for any value from 1.0 in/h to 1.1 in/h.
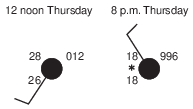
Base your responses to questions 11 on the station models below and on your knowledge of Earth science. The changing weather conditions at a location in New York State during a winter storm are recorded on the station models.
11
From 12 noon Thursday until 8 p.m. Thursday, the total amount of snowfall was 12 inches. Calculate the snowfall rate, in inches per hour. [1]
Snowfall rate =
Allow 1 credit for 1.5 in/h or 1 1__2 in/h.
• Note: Do not allow credit for 12__8 or 3__2 in/h because these do not show a complete calculation.
Base your answers to questions 12 on the weather map in image provided and on your knowledge of Earth science. The weather map shows the center of a high-pressure system (H) and the center of a low-pressure system (L) affecting North America. Isobars are drawn for the eastern portion of the map, and one isobar is drawn around the high-pressure center. Air pressures are shown at various points in the western portion of the map. All air pressures were recorded in millibars (mb). Points A through F represent surface locations.
12
Calculate the air pressure gradient between locations A and B in millibars per kilometer. [1]
______________ mb/km
Allow 1 credit for any value from 0.016 to 0.027 mb/km.
• Note: Do not allow credit for 4/200 or 1/50 because this does not show a complete calculation.
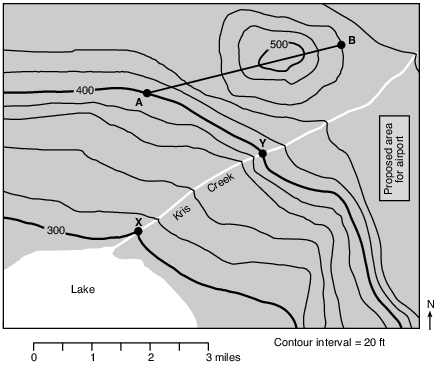
Base your answers to questions 13 on the topographic map below and on your knowledge of Earth science. The map shows features and contour lines in the region of a proposed airport. Line AB is a reference line on the map. Points X and Y represent surface locations along a creek. Elevations are shown in feet.
13
Calculate the gradient along Kris Creek between locations X and Y. Label your answer with the correct units. [1]
Allow 1 credit for any value from 37 to 43 with correct units. Acceptable units include, but are not limited to:
• — ft/mi
• — feet/mi
• — feet per mile
Base your answers to questions 14 on the topographic map in image provided. Letters A through D represent locations on the map. Elevations are measured in feet. Dashed lines represent trails.
14
How long will it take a person to hike along the trail from point C to point D at a rate of 3 miles per hour? [1]
__________ h
Allow 1 credit for any value from 1.8 h to 2.2 h.
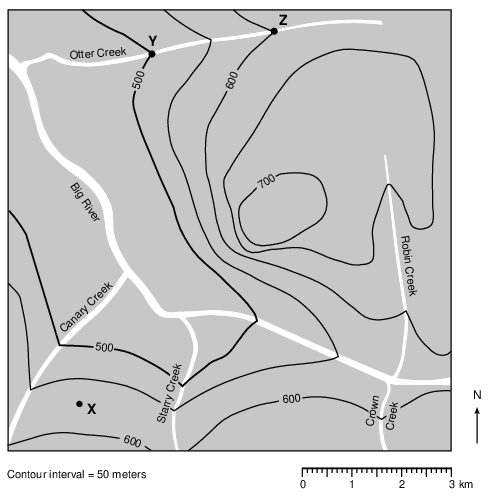
Base your answers to questions 15 on the topographic map below and on your knowledge of Earth science. Points X, Y, and Z indicate surface locations. Elevations are shown in meters.
15
Calculate the gradient of Otter Creek, in meters per kilometer, between points Y and Z. [1]
______________ m/km
Allow 1 credit for any value from 38 m/km to 42 m/km.