Earth Science worksheet
    Topic: Latitude And Longitude
    Latitude And Longitude
    1

    An observer on Earth measures the angle of sight between Venus and the setting Sun.

    seasons-and-astronomy, earth-rotation, maps-and-measurement, latitude-and-longitude, standard-1-math-and-science-inquery, velocity-slope-sediment-size-channel-shape-stream-valume-distance-from-the-sun-gravitational-force-period-of-revolution-speed-of-revolution fig: esci12013-exam_g1.png

    Which statement best describes and explains the apparent motion of Venus over the next few hours?

    (1) Venus will set 1 hour after the Sun because Earth rotates at 45° per hour.

    (2) Venus will set 2 hours after the Sun because Venus orbits Earth faster than the Sun orbits Earth.

    (3) Venus will set 3 hours after the Sun because Earth rotates at 15° per hour.

    (4) Venus will set 4 hours after the Sun because Venus orbits Earth slower than the Sun orbits Earth.

    2

    At a location in the Northern Hemisphere, a camera was placed outside at night with the lens pointing straight up. The shutter was left open for four hours, resulting in the star trails shown below.

    seasons-and-astronomy, earth-rotation, maps-and-measurement, latitude-and-longitude, standard-6-interconnectedness, models fig: esci12014-examw_g4.png

    At which latitude were these star trails observed?

    (1) 1° N

    (2) 30° N

    (3) 60° N

    (4) 90° N

    Base your answers to questions 3 on the diagram below and on your knowledge of Earth science. The diagram represents Earth’s revolution around the Sun. Points A, B, C, and D represent Earth’s positions in its orbit on the first day of each of the four seasons. The major axis and the foci (the center of the Sun and the other focus) of Earth’s orbit are shown.

    reference-tables, solar-system-data, seasons-and-astronomy, motion-of-objects-in-the-solar-system, standard-1-math-and-science-inquery, eccentricity-rate-gradient-standard-error, standard-1-math-and-science-inquery, geocentric-model-heliocentric-model, standard-1-math-and-science-inquery, changing-length-of-a-shadow-based-on-the-motion-of-the-sun, standard-6-interconnectedness, models fig: esci12015-examw_g36.png

    3

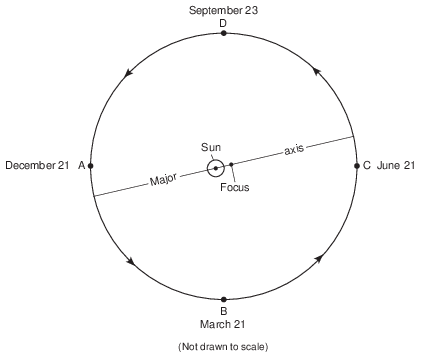
    At positions A, B, C, and D, the north end of Earth’s axis of rotation is pointing toward

    (1) Betelgeuse

    (2) Polaris

    (3) the center of the Milky Way

    (4) the center of our solar system

    4

    The diagram below represents an observer measuring the altitude of Polaris.

    maps-and-measurement, latitude-and-longitude, standard-6-interconnectedness, models fig: esci12016-examw_g2.png

    At which latitude is this observer located?

    (1) 16° N

    (2) 37° N

    (3) 53° N

    (4) 90° N

    5

    New York State’s highest peak, Mt. Marcy, is located at approximately

    (1) 44°10⬘ N 74°05⬘ W

    (2) 44°05⬘ N 73°55⬘ W

    (3) 73°55⬘ N 44°10⬘ W

    (4) 74°05⬘ N 44°05⬘ W

    6

    The model below represents the apparent path of the Sun across the sky on March 21 as seen by an observer on Earth.

    maps-and-measurement, latitude-and-longitude, standard-1-math-and-science-inquery, geocentric-model-heliocentric-model, standard-6-interconnectedness, models fig: esci12016-examw_g3.png

    At which latitude is the observer located?

    (1) 90° N

    (2) 42° N

    (3) 23.5° N

    (4) 0°

    7

    On April 21, the altitude of Polaris, as viewed from a location in New York State, was measured as 41.3°. What will the altitude of Polaris be when viewed one month later, on May 21, from the same location?

    (1) 23.5°

    (2) 41.3°

    (3) 66.7°

    (4) 90°

    Base your answers to questions 8 on the map below and on your knowledge of Earth science. The map shows the four time zones across the continental United States. Eight cities are labeled on the map.

    seasons-and-astronomy, earth-rotation, standard-1-math-and-science-inquery, velocity-slope-sediment-size-channel-shape-stream-valume-distance-from-the-sun-gravitational-force-period-of-revolution-speed-of-revolution, standard-6-interconnectedness, models, standard-6-interconnectedness, patterns-of-change fig: esci-v202-exam_g50.png

    8

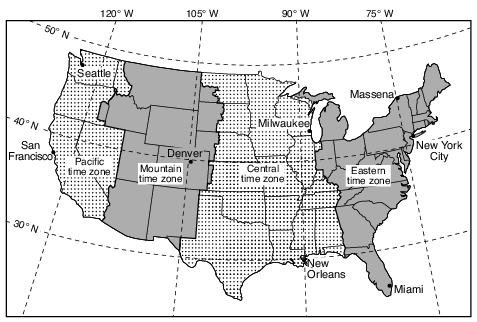
    Identify the city on the map where the altitude of Polaris is closest to 45 degrees. [1]

    Allow 1 credit for Massena.

    Base your answers to questions 9 on the experiment description and diagram below.

    A student was interested in how the angle of insolation affects absorption of radiation. The student took three black metal plates, each containing a built-in thermometer, and placed them at the same distance from three identical lamps. The plates were tilted so that the light from the lamps created three different angles of incidence with the center of the plates, as shown in the diagram. The starting temperatures of the plates were recorded. The lamps were turned on for 10 minutes. Then the final temperatures were recorded.

    insolation-and-the-seasons, variations-of-insolation, standard-6-interconnectedness, models fig: esci12012-examw_g38.png

    9

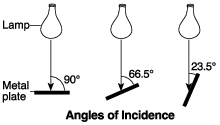
    The metal plate at a 90° angle of incidence represents a location on Earth at solar noon on March 21. What is the latitude of this location? [1]

    Allow 1 credit for 0° latitude or the equator.

    Base your answers to questions 10 on the diagram in image provided, which shows Earth as viewed from space on December 21. Some latitudes are labeled.
    10

    At which latitude is Polaris observed at an altitude of 66.5°? [1]

    Allow 1 credit. Acceptable responses include, but are not limited to:

    • — 66.5° N or 66 1__2 ° N or 66° 30' N

    • — at the Arctic Circle

    • Note: Units and a compass direction must be included if a numerical latitude is given.

    Base your answers to questions 11 on the data table below, the map on the following page, and on your knowledge of Earth science. The data table shows the air pressure in the eye (center) and the maximum sustained wind speed around the eye of Hurricane Wilma from October 18 through October 25, 2005. The data were collected at the same time each day. The map shows the geographic locations of the eye of Hurricane Wilma from October 18 to October 25.

    maps-and-measurement, latitude-and-longitude, standard-6-interconnectedness, models fig: esci12014-examw_g31.png

    maps-and-measurement, latitude-and-longitude, standard-6-interconnectedness, models fig: esci12014-examw_g32.png

    11

    Identify the latitude and longitude of the eye of Hurricane Wilma on October 24. Label your answer with the correct units and directions. [1]

    Latitude:

    Longitude:

    Allow 1 credit. Acceptable responses include, but are not limited to:

    • Latitude:

    • — 27° N

    • — 27 degrees North

    • Longitude:

    • — 80° W

    • — eighty° west

    Base your answers to questions 12 on the diagram in image provided and on your knowledge of Earth science. The diagram represents the orbits of Earth, Venus, and Mercury. Earth, Venus, and Mercury are shown with a dot on each of their orbital paths. The numbers on each orbital path indicate the planet’s positions on successive days in its revolution. Point M is a position on Earth’s orbit. Each season in the Northern Hemisphere on Earth is labeled.
    12

    What latitude on Earth receives the vertical rays from the Sun when Earth is at position M? [1]

    Allow 1 credit. Acceptable responses include, but are not limited to:

    • — 0°

    • — equator

    • Note: Allow credit even if the student wrote “0° N” or “0° S.”
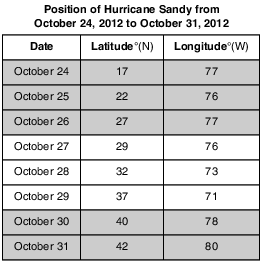
    Base your answers to questions 13 on the passage and map below and on your knowledge of Earth science. The map shows the positions of the eye (center) of Hurricane Sandy in its path from October 24 to October 31, 2012. A high-pressure center (H) is shown on the map.

    Hurricane Sandy

    In October 2012, Hurricane Sandy produced extreme damage to New York City and the coast of New Jersey due to high winds and a high storm surge. A storm surge is the rise in the level of ocean water along a coast that is caused by strong winds blowing toward land from a severe storm. High ocean tides, occurring at the same time, added to the height of the storm surge. A high-pressure center, located just south of Newfoundland, Canada, affected Hurricane Sandy by altering the path of the jet stream. This change in the jet stream, combined with surface wind circulation around the high-pressure center, caused Hurricane Sandy to curve westward, making landfall along the coast of New Jersey.

    maps-and-measurement, latitude-and-longitude, standard-1-math-and-science-inquery, velocity-slope-sediment-size-channel-shape-stream-valume-distance-from-the-sun-gravitational-force-period-of-revolution-speed-of-revolution fig: esci12017-examw_g30.png

    13

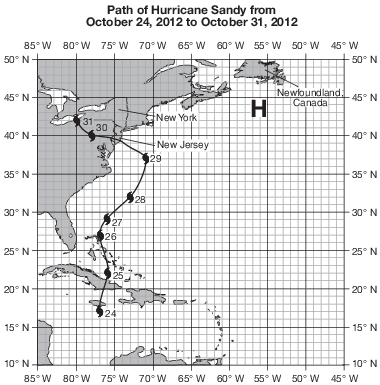
    Using information from the map, complete the data table in the image below by identifying the latitude and longitude positions of the eye of Hurricane Sandy from October 27, 2012 to October 29, 2012. Express your latitude and longitude positions to the nearest whole degree. [1]

    maps-and-measurement, latitude-and-longitude, standard-1-math-and-science-inquery, velocity-slope-sediment-size-channel-shape-stream-valume-distance-from-the-sun-gravitational-force-period-of-revolution-speed-of-revolution fig: esci12017-ansbk_abkq2.png

    Allow 1 credit if all three student latitudes and all three student longitudes are correct.

    maps-and-measurement, latitude-and-longitude, standard-1-math-and-science-inquery, velocity-slope-sediment-size-channel-shape-stream-valume-distance-from-the-sun-gravitational-force-period-of-revolution-speed-of-revolution fig: esci12017-rg_g2.png

    Base your answers to questions 14 on the map below and on your knowledge of Earth science. The map shows areas of daylight and darkness in New York State on March 21. Six locations are labeled on the map.

    seasons-and-astronomy, earth-rotation, standard-1-math-and-science-inquery, geocentric-model-heliocentric-model fig: esci12018-examw_g50.png

    14

    State the altitude of Polaris as seen by an observer on Slide Mountain. [1]

    °

    Allow 1 credit for 42°.

    • Note: Do not allow credit if a compass direction is given (e.g., 42 N or 42° N) because that

    • indicates latitude, not altitude.

    Base your answers to questions 15 on the calendar and data table below. The calendar shows the month of February 2007, indicating the dates when some lunar phases occurred. February 24 lists only the name of the Moon phase that occurred on that day. The data table shows the highest and lowest tides (in feet) recorded for the Hudson River at Kingston, New York, over a 2-day period in February 2007.

    seasons-and-astronomy, tides, seasons-and-astronomy, motion-of-objects-in-the-solar-system, standard-1-math-and-science-inquery, eccentricity-rate-gradient-standard-error fig: esci62012-exam_w_g64.png

    seasons-and-astronomy, tides, seasons-and-astronomy, motion-of-objects-in-the-solar-system, standard-1-math-and-science-inquery, eccentricity-rate-gradient-standard-error fig: esci62012-exam_w_g65.png

    15

    Determine the altitude of Polaris at Kingston, New York, to the nearest degree. [1]

    °

    Allow 1 credit for 42°.