
Topic: Measuring Weather Variables
Measuring Weather Variables
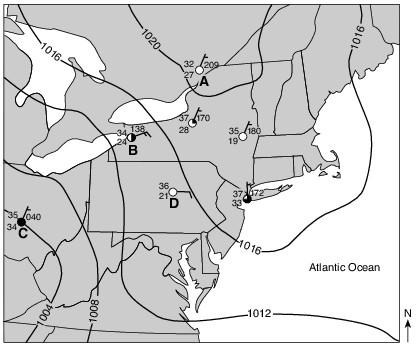
Which weather information shown at station B was measured with an anemometer and weather vane?
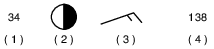
(1) 1
(2) 2
(3) 3
(4) 4
A weather station model is shown below.

Which information shown on the station model is most closely associated with measurements from an anemometer?
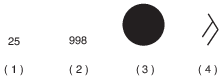
(1) 1
(2) 2
(3) 3
(4) 4
Which weather instrument is used to determine wind direction?

(1) 1
(2) 2
(3) 3
(4) 4
Which weather instrument is most useful in measuring relative humidity?
(1) barometer
(2) anemometer
(3) psychrometer
(4) wind vane
Which weather instrument is used to measure air temperatures recorded on a weather map?
(1) anemometer
(2) wind vane
(3) thermometer
(4) barometer
The diagram below shows a weather instrument used to determine relative humidity.

What is the relative humidity?
(1) 40%
(2) 36%
(3) 8%
(4) 4%
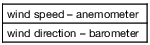
Which set of instruments is correctly paired with the weather variables that they measure?
(1) 
(2) 
(3) 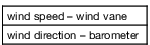
(4) 
A psychrometer is used to determine which weather variables?
(1) wind speed and wind direction
(2) percentage of cloud cover and cloud height
(3) air pressure and air temperature
(4) relative humidity and dewpoint
Identify the weather instrument used to measure air pressure. [1]
Allow 1 credit for barometer or barograph.
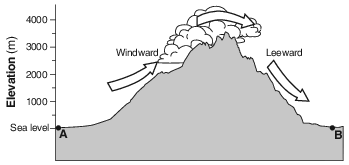
Identify one weather instrument that could be used to determine the dewpoint of the air at point A. [1]
Allow 1 credit. Acceptable responses include, but are not limited to:
• — psychrometer
• — wet- and dry-bulb thermometer
• — hygrometer
Identify the weather instrument used to measure air pressure. [1]
Allow 1 credit for barometer or barograph.
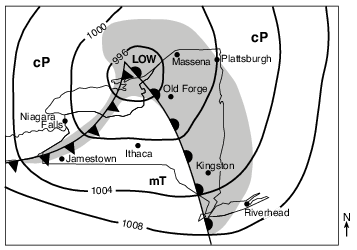
Identify the weather instrument that was used to measure the air pressures recorded on the map. [1]
Allow 1 credit for barometer or barograph.
The table below lists some weather conditions for another location on this map.
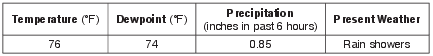
On the weather station model in your answer booklet, using the proper format, record the weather conditions listed in the table. [1]

Allow 1 credit if all four weather conditions are in the correct location and in the correct format.
• Note: Do not allow credit for “0.85” because this is not the correct format used on a weather
• station model.
• Example of a 1-credit response:
• 

Identify the name of the weather instrument used to measure the wind speed at Plattsburgh. [1]
Allow 1 credit. Acceptable responses include, but are not limited to:
• — anemometer
• — wind meter
• — wind sock
• — wind gauge
• — Doppler radar
Identify the weather instrument usually used to measure wind speed. [1]
Allow 1 credit for anemometer or wind speed meter.