Topic: Motion Of Objects In The Solar System
Motion Of Objects In The Solar System
The photographs below show two celestial objects just before, during, and just after a total solar eclipse as viewed by an observer located in Kingston, Tennessee, on August 21, 2017.

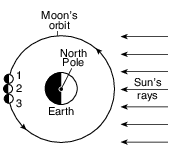
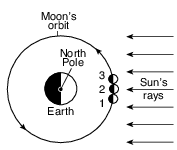
Which diagram represents the location of the Moon in its orbit at the time that each of these three photographs (1, 2, and 3) were taken? (Diagrams are not drawn to scale.)
(1) 
(2) 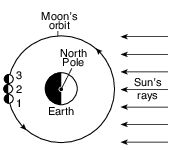
(3) 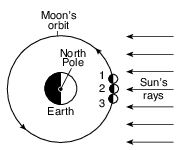
(4) 
The diagram below represents Earth in four positions, labeled A, B, C, and D, in its orbit around the Sun on the first day of each season.
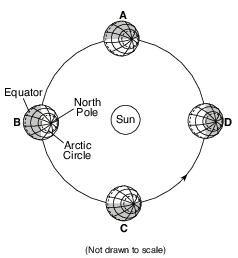
Between which two consecutive positions is the summer season occurring in the Northern Hemisphere?
(1) A and B
(2) B and C
(3) C and D
(4) D and A

The arrangement and movement of celestial objects in our solar system is best described by the
(1) spiral model
(2) cosmic model
(3) geocentric model
(4) heliocentric model
Which event is cyclic and predictable?
(1) a volcano erupting above a subducting tectonic plate
(2) an earthquake occurring at the San Andreas Fault
(3) Jupiter’s apparent movement across the night sky
(4) an asteroid striking Earth’s surface
A high tide occurred at 6:00 a.m. at a beach on Long Island. The next high tide at this same beach would occur at approximately
(1) 12:15 p.m. on the same day
(2) 6:30 p.m. on the same day
(3) 12:45 p.m. on the following day
(4) 7:00 a.m. on the following day
Seasonal changes on Earth are primarily caused by the
(1) parallelism of the Sun’s axis as the Sun revolves around Earth
(2) changes in distance between Earth and the Sun
(3) elliptical shape of Earth’s orbit around the Sun
(4) tilt of Earth’s axis as Earth revolves around the Sun
During which Northern Hemisphere season is Earth closest to the Sun?
(1) spring
(2) summer
(3) autumn
(4) winter
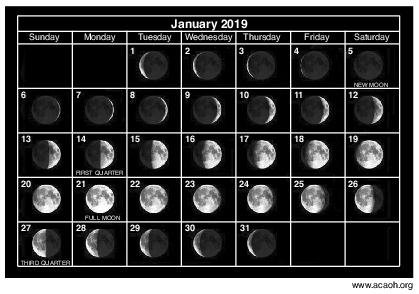
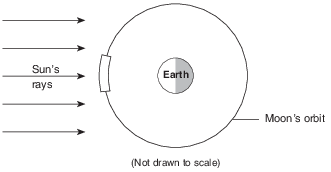
In image below, circle the position of the Moon in its orbit that produced the moon phase observed on January 17, 2019. [1]

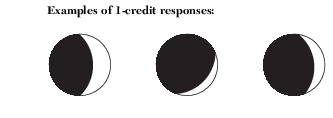
Allow 1 credit for circling only the position shown in the example below.

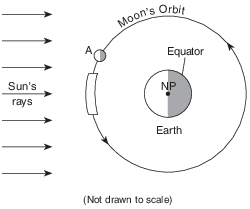
On the diagram in the image provided, shade the portion of the Moon that is in darkness as viewed from New York State when the Moon is at position 1. [1]

Allow 1 credit if the student shades more than half of the Moon, leaving a lighted portion on the right edge as shown below.
• 
State one factor, other than the tilt of Earth’s axis, that causes seasons to change on Earth. [1]
Allow 1 credit. Acceptable responses include, but are not limited to:
• — parallelism of Earth’s axis
• — The North Pole always points toward Polaris.
• — revolution of Earth
• — location of the Sun’s vertical ray
• — duration/intensity of insolation
• — angle of insolation
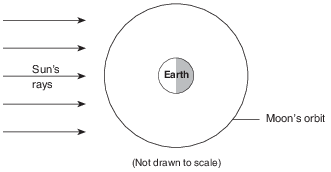
On the diagram in the image provided, circle the position of the Moon where a solar eclipse is possible. [1]

Allow 1 credit for circling only position 6.
On the diagram in the image provided, place an X on each planet’s orbital path to show the positions of Earth, Venus, and Mercury on the 55th day of each planet’s orbit. [1]

Allow 1 credit if the centers of all three Xs are within the circles shown below.
• Note: Do not allow credit if more than one X is placed on any orbit.
• Allow credit even if a symbol other than an X is used.. It is recommended that an overlay of the same scale as the student answer booklet be used to ensure reliability in rating.
• 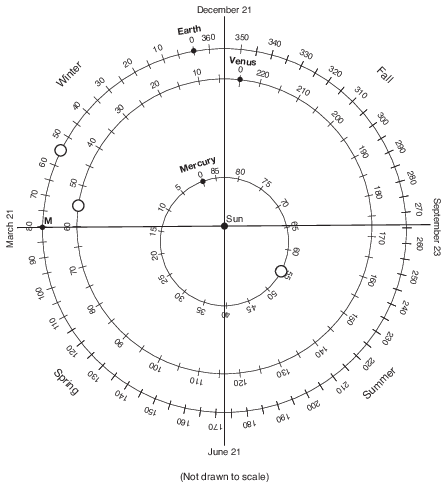

On the diagram in the image provided, place an X on the Moon’s orbit to indicate the Moon’s position on April 15. [1]
Allow 1 credit if the center of the X is drawn within or touches the clear banded region shown below.
• Note: Allow credit if a symbol other than an X is used.
• It is recommended that an overlay of the same scale as the student answer booklet be used to ensure reliability in rating.
• 

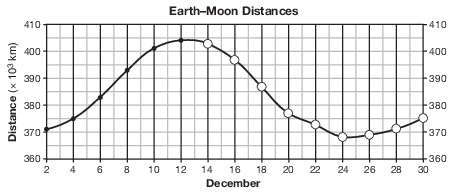
On the grid in the image provided, the Earth–Moon distance data from December 2 to December 12 have already been plotted. Complete the line graph by plotting the Earth–Moon distances from December 14 to December 30. Continue the line from December 12 through all nine of your plotted points. [1]
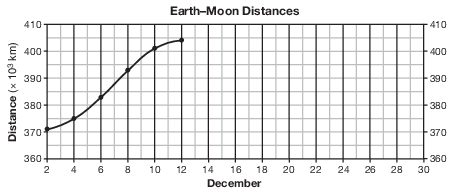
Allow 1 credit if the centers of all nine of the student’s plots are within or touch the circles shown and all 15 plots are correctly connected with a line that passes within or touches each circle.
• Note: Allow credit if the line misses a plot but is still within or touches the circle.
• It is recommended that an overlay of the same scale as the student answer booklet be used to ensure reliability in rating.
• 
On the diagram in the image provided, place an X on the Moon’s orbit to indicate the position of the Moon when a solar eclipse would be observed from Earth. [1]
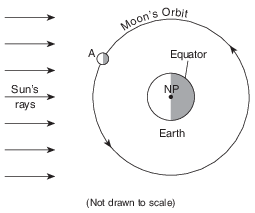
Allow 1 credit if the center of the X is within or touches the box on the Moon’s orbit, as shown below.
• Note: It is recommended that an overlay of the same scale as the student answer sheet be used to
• ensure reliability in rating.. Allow credit if a symbol other than an X is used.
•