Earth Science worksheet
    Topic: Pressure Centers
    Pressure Centers
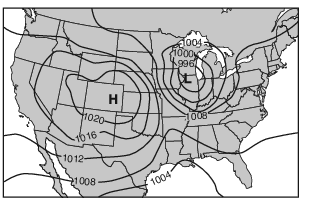
    Base your answers to questions 1 on the weather map below, which shows the locations of a high-pressure center (H) and a low-pressure center (L) over a portion of North America. The isolines indicate surface air pressures.

    meteorology, presentation-of-weather-data, standard-6-interconnectedness, models fig: esci12013-exam_g25.png

    1

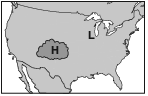
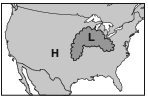
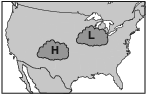
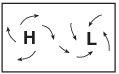
    Which map shows the most likely location of clouds associated with these pressure centers?

    (1) meteorology, effect-of-vertical-atmospheric-movement, meteorology, dewpoint-humidty-cloud-formation, meteorology, pressure-centers, standard-6-interconnectedness, models fig: esci12013-exam_g21.png

    (2) meteorology, effect-of-vertical-atmospheric-movement, meteorology, dewpoint-humidty-cloud-formation, meteorology, pressure-centers, standard-6-interconnectedness, models fig: esci12013-exam_g22.png

    (3) meteorology, effect-of-vertical-atmospheric-movement, meteorology, dewpoint-humidty-cloud-formation, meteorology, pressure-centers, standard-6-interconnectedness, models fig: esci12013-exam_g23.png

    (4) meteorology, effect-of-vertical-atmospheric-movement, meteorology, dewpoint-humidty-cloud-formation, meteorology, pressure-centers, standard-6-interconnectedness, models fig: esci12013-exam_g24.png

    2

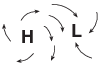
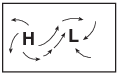
    Which map best represents the surface wind pattern around Northern Hemisphere high-pressure and low-pressure centers?

    (1) meteorology, transfer-of-heat-energy, meteorology, pressure-centers, standard-6-interconnectedness, models fig: esci12015-examw_g4.png

    (2) meteorology, transfer-of-heat-energy, meteorology, pressure-centers, standard-6-interconnectedness, models fig: esci12015-examw_g5.png

    (3) meteorology, transfer-of-heat-energy, meteorology, pressure-centers, standard-6-interconnectedness, models fig: esci12015-examw_g6.png

    (4) meteorology, transfer-of-heat-energy, meteorology, pressure-centers, standard-6-interconnectedness, models fig: esci12015-examw_g7.png

    Base your answers to questions 3 on the weather maps below and on your knowledge of Earth science. The weather maps show the eastern United States on two consecutive days. Some isobars are labeled in millibars (mb). Letter X represents a location on Earth’s surface on December 8, 2009.

    meteorology, presentation-of-weather-data, standard-1-math-and-science-inquery, velocity-slope-sediment-size-channel-shape-stream-valume-distance-from-the-sun-gravitational-force-period-of-revolution-speed-of-revolution, standard-1-math-and-science-inquery, changing-length-of-a-shadow-based-on-the-motion-of-the-sun, standard-6-interconnectedness, models fig: esci12016-examw_g36.png

    3

    In which direction did the high-pressure center move from December 8, 2009, to December 9, 2009?

    (1) southwest

    (2) southeast

    (3) northwest

    (4) northeast

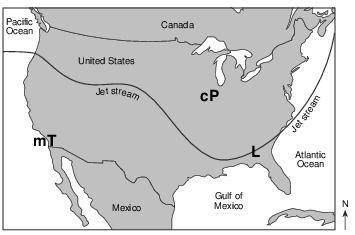
    Base your answers to questions 4 on the map below, which shows the position of the jet stream relative to two air masses and a low-pressure center (L) over the United States.

    reference-tables, selected-properties-of-earth-atmosphere, meteorology, transfer-of-heat-energy, meteorology, jet-streams, meteorology, the-atmosphere, standard-6-interconnectedness, models fig: esci82012-examw_g44.png

    4

    Assuming the low-pressure center (L) follows a typical storm track, it will move

    (1) into the mT air mass to the west

    (2) into the cP air mass to the northwest

    (3) along the path of the jet stream to the northeast

    (4) along the path of the jet stream to the southwest

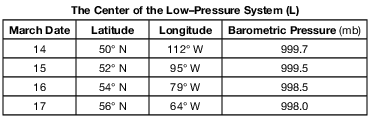
    Base your answers to questions 5 on the table below, on the map in image provided, and on your knowledge of Earth science. The table lists the latitude, longitude, and barometric pressure, in millibars (mb), of the center of a low-pressure system (L) as it moved across North America from March 14 to March 17. The map in image provided shows the center of this low-pressure system (L) and associated fronts on March 14. The location of the low-pressure system 24 hours later on March 15 is also indicated.

    meteorology, presentation-of-weather-data, standard-1-math-and-science-inquery, eccentricity-rate-gradient-standard-error, standard-6-interconnectedness, models fig: esci12015-examw_g57.png

    5

    Calculate the average speed, in kilometers per hour, at which this low-pressure center (L) traveled during the 24 hours between March 14 and March 15. [1]

    km/h

    Allow 1 credit for any value from 45 km/h to 55 km/h.

    Base your answers to questions 6 on the map in image provided, which represents the center of a low-pressure system indicated by L. The 1000-millibar (mb) isobar is drawn around the center of this low-pressure system.
    6

    Identify one factor that usually causes many low-pressure centers to generally move from west to east across the United States. [1]

    Allow 1 credit. Acceptable responses include, but are not limited to:

    • — the prevailing southwest winds

    • — the jet stream

    • — planetary winds