Earth Science worksheet
    Topic: Radioactive Isotopes Dating
    Radioactive Isotopes Dating
    1

    The graph below shows the rate of decay of a radioactive isotope through two half-lives. Each box shows the ratio of atoms of the radioactive isotope to atoms of the disintegration product. The box at two half-lives has been left blank.

    earth-history, earth-history, radioactive-isotopes-dating, standard-1-math-and-science-inquery, velocity-slope-sediment-size-channel-shape-stream-valume-distance-from-the-sun-gravitational-force-period-of-revolution-speed-of-revolution fig: esci-v202-exam_g17.png

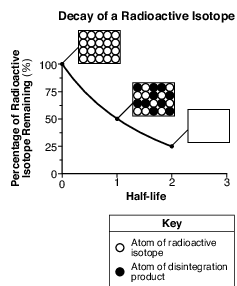
    Which box best represents the ratio of these atoms at two half-lives?

    (1) earth-history, earth-history, radioactive-isotopes-dating, standard-1-math-and-science-inquery, velocity-slope-sediment-size-channel-shape-stream-valume-distance-from-the-sun-gravitational-force-period-of-revolution-speed-of-revolution fig: esci-v202-exam_g13.png

    (2) earth-history, earth-history, radioactive-isotopes-dating, standard-1-math-and-science-inquery, velocity-slope-sediment-size-channel-shape-stream-valume-distance-from-the-sun-gravitational-force-period-of-revolution-speed-of-revolution fig: esci-v202-exam_g14.png

    (3) earth-history, earth-history, radioactive-isotopes-dating, standard-1-math-and-science-inquery, velocity-slope-sediment-size-channel-shape-stream-valume-distance-from-the-sun-gravitational-force-period-of-revolution-speed-of-revolution fig: esci-v202-exam_g15.png

    (4) earth-history, earth-history, radioactive-isotopes-dating, standard-1-math-and-science-inquery, velocity-slope-sediment-size-channel-shape-stream-valume-distance-from-the-sun-gravitational-force-period-of-revolution-speed-of-revolution fig: esci-v202-exam_g16.png

    2

    Due to radioactive decay, an igneous rock sample now contains one-fourth of the amount of potassium-40 that it originally contained. The age, in years, of this rock sample is approximately

    (1) 0.7 109 y

    (2) 1.3 109 y

    (3) 2.6 109 y ×× ××

    (4) 5.2 109 y

    3

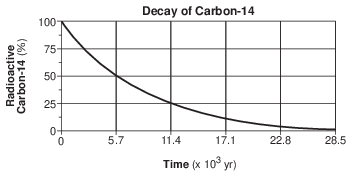
    The graph below shows the decay of a radioactive material over time.

    earth-history, earth-history, radioactive-isotopes-dating, standard-1-math-and-science-inquery, eccentricity-rate-gradient-standard-error fig: esci12013-exam_g13.png

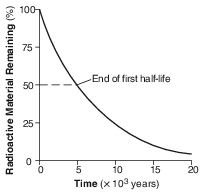
    How long does it take for this radioactive material to decay through 2 half-lives?

    (1) 1 × 10³ years

    (2) 5 × 10³ years

    (3) 10 × 103 years

    (4) 40 × 103 years

    4

    A bar graph of the radioactive decay of carbon-14 is shown below.

    reference-tables, radioactive-decay-data, earth-history, earth-history, radioactive-isotopes-dating, standard-1-math-and-science-inquery, changing-length-of-a-shadow-based-on-the-motion-of-the-sun, standard-6-interconnectedness, models, standard-6-interconnectedness, patterns-of-change fig: esci12015-examw_g24.png

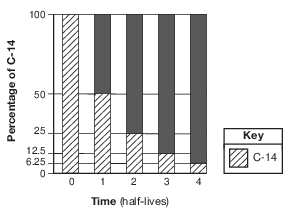
    The solid black sections of the bars on the graph represent the percentages of

    (1) carbon-14 from the original sample that has not decayed

    (2) uranium-238 from the original sample that has not decayed

    (3) nitrogen-14 decay product resulting from the radioactive decay

    (4) lead-206 decay product resulting from the radioactive decay

    5

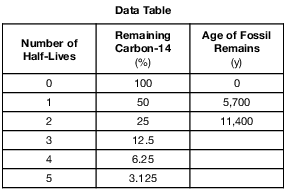
    How old is a bone that has 12.5% of the original amount of radioactive carbon-14 remaining?

    (1) 5,700 years

    (2) 11,400 years

    (3) 17,100 years

    (4) 22,800 years

    6

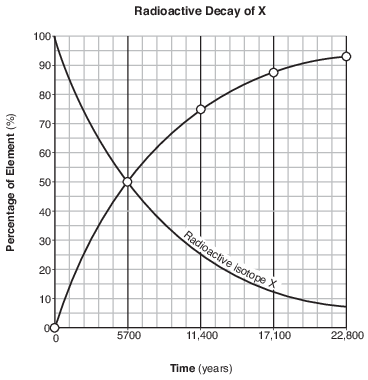
    The graph below shows the radioactive decay of rubidium-87.

    earth-history, earth-history, radioactive-isotopes-dating, standard-1-math-and-science-inquery, eccentricity-rate-gradient-standard-error, standard-1-math-and-science-inquery, velocity-slope-sediment-size-channel-shape-stream-valume-distance-from-the-sun-gravitational-force-period-of-revolution-speed-of-revolution fig: esci12017-examw_g7.png

    What percentage of rubidium-87 atoms will be left after four half-lives?

    (1) 25.0%

    (2) 12.5%

    (3) 6.25%

    (4) 3.125%

    Base your answers to questions 7 on the table below and on your knowledge of Earth science. The table shows the disintegration products and half-lives of five commonly used radioactive isotopes.

    earth-history, earth-history, radioactive-isotopes-dating, standard-1-math-and-science-inquery, changing-length-of-a-shadow-based-on-the-motion-of-the-sun fig: esci12020-examw_g25.png

    7

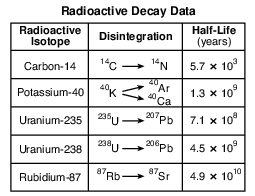
    Which radioactive isotope takes the greatest amount of time to disintegrate?

    (1) potassium-40

    (2) uranium-235

    (3) uranium-238

    (4) rubidium-87

    8

    Which radioactive isotope is most often used when determining the age of fossil bones found in sediments deposited during the Holocene Epoch?

    (1) carbon-14

    (2) potassium-40

    (3) uranium-238

    (4) rubidium-87

    Base your answers to questions 9 on the geologic cross section and photograph below and on your knowledge of Earth science. The cross section represents the Palisades sill in southern New York State and the surrounding bedrock. Potassium-40 analysis determined the sill to be approximately 200,000,000 years old. The photograph shows a mastodont tooth found in glacial sediments nearby. Carbon-14 analysis determined this tooth to be approximately 11,400 years old.

    reference-tables, scheme-for-metamorphic-rock-identification, rocks-and-minerals, formation-classification-and-application-of-rocks, standard-1-math-and-science-inquery, changing-length-of-a-shadow-based-on-the-motion-of-the-sun, standard-6-interconnectedness, models fig: esci62013-examw_g45.png

    9

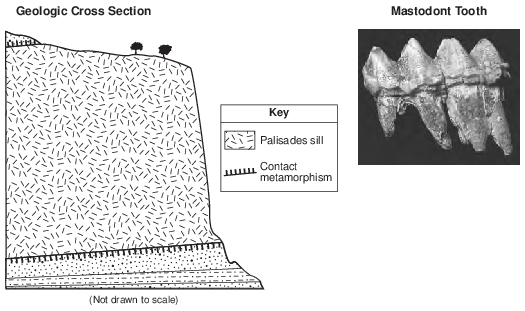
    Potassium-40 is useful for radioactive dating of the Palisades sill because the half-life of potassium-40

    (1) decreased as the amounts of 40Ar and 40Ca in the sill increased

    (2) remained constant during the radioactive decay process

    (3) increased as pressure from the overlying sedimentary rock increased

    (4) was shortened by the high temperature of the magma that formed the sill

    Base your answers to questions 10 on the data table and information below and on your knowledge of Earth science. The data table shows the radioactive decay of carbon-14 and the age of fossil remains, in years (y). Part of the table has been left blank.

    reference-tables, radioactive-decay-data, earth-history, earth-history, radioactive-isotopes-dating, standard-1-math-and-science-inquery, changing-length-of-a-shadow-based-on-the-motion-of-the-sun, standard-6-interconnectedness, models fig: esci12014-examw_g33.png

    10

    Identify the decay product when carbon-14 undergoes radioactive disintegration. [1]

    Allow 1 credit. Acceptable responses include, but are not limited to:

    • — 14N

    • — nitrogen-14/N-14

    • — nitrogen/N

    Base your answers to questions 11 on the data table below, on the graph in image provided, and on your knowledge of Earth science. The data table shows the percentage of the stable disintegration product produced over time by the radioactive decay of isotope X after each half-life. The graph shows the percentage of radioactive isotope X remaining over time during the radioactive decay of isotope X.

    earth-history, earth-history, radioactive-isotopes-dating, standard-1-math-and-science-inquery, eccentricity-rate-gradient-standard-error fig: esci12018-examw_g52.png

    11

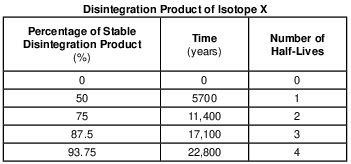
    On the graph in the image provided, plot the percentage of stable disintegration product for each of the times shown on the data table and connect all five plots with a line. [1]

    earth-history, earth-history, radioactive-isotopes-dating, standard-1-math-and-science-inquery, eccentricity-rate-gradient-standard-error fig: esci12018-ansbk_abkq4.png

    Allow 1 credit if the centers of all five plots are within or touch the circles shown and are correctly connected with a line that passes within or touches each circle.

    • Note: Allow credit if the student-drawn line does not pass through the student plots, but is still

    • within or touches the circles.

    • It is recommended that an overlay of the same scale as the student answer booklet be used to ensure reliability in rating.

    • Example of a 1-credit response:

    earth-history, earth-history, radioactive-isotopes-dating, standard-1-math-and-science-inquery, eccentricity-rate-gradient-standard-error fig: esci12018-rg_g4.png

    Base your answers to questions 12 on the diagram in image provided and on your knowledge of Earth science. The diagram represents a model of the radioactive decay of carbon-14. The white boxes represent radioactive carbon-14 remaining, and the black boxes represent the disintegration product after the fi rst half-life.
    12

    On the diagram in the image provided, shade in the correct number of carbon-14 boxes to represent the additional disintegration product after the second half-life. [1]

    earth-history, earth-history, radioactive-isotopes-dating, standard-1-math-and-science-inquery, eccentricity-rate-gradient-standard-error, standard-1-math-and-science-inquery, geocentric-model-heliocentric-model, standard-6-interconnectedness, models fig: esci12019-ansbk_abkq4.png

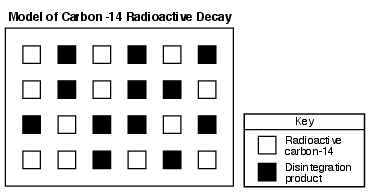
    Allow 1 credit for shading in any six additional carbon-14 boxes (leaving only six boxes unshaded).

    Base your answers to questions 13 on the graph below and on your knowledge of Earth science. The graph shows the rate of decay of the radioactive isotope carbon-14 (14C).

    reference-tables, scheme-for-igneous-rock-identification, earth-history, earth-history, radioactive-isotopes-dating, standard-1-math-and-science-inquery, use-isolines-to-determine-a-source-of-pollution, standard-6-interconnectedness, models fig: esci62016-examw_g46.png

    13

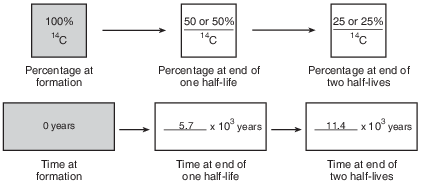
    Complete the flow chart in the image provided by filling in the boxes to indicate the percentage of carbon-14 remaining and the time that has passed at the end of each half-life. [1]

    reference-tables, scheme-for-igneous-rock-identification, earth-history, earth-history, radioactive-isotopes-dating, standard-1-math-and-science-inquery, use-isolines-to-determine-a-source-of-pollution, standard-6-interconnectedness, models fig: esci62016-ansbk_abkq3.png

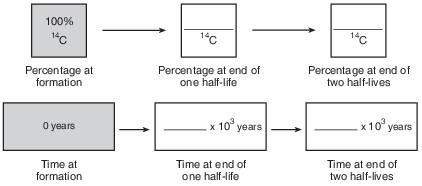
    Allow 1 credit if all of the percentages and ages are correct, as shown below.

    reference-tables, scheme-for-igneous-rock-identification, earth-history, earth-history, radioactive-isotopes-dating, standard-1-math-and-science-inquery, use-isolines-to-determine-a-source-of-pollution, standard-6-interconnectedness, models fig: esci62016-rg_g3.png

    • Note: Allow credit if the student shades the second box 50% and the third box 25% in the first

    • row of boxes.

    Base your answers to questions 14 on the data table below, on the graph in image provided, and on your knowledge of Earth science. The data table shows the projected percentages of radioactive isotope X remaining and its disintegration product Z forming over 6.5 billion years. The graph shows the disintegration of radioactive isotope X.

    earth-history, earth-history, radioactive-isotopes-dating, standard-1-math-and-science-inquery, velocity-slope-sediment-size-channel-shape-stream-valume-distance-from-the-sun-gravitational-force-period-of-revolution-speed-of-revolution, standard-6-interconnectedness, patterns-of-change fig: esci62019-examw_g36.png

    14

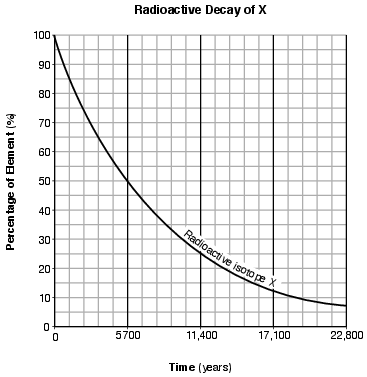
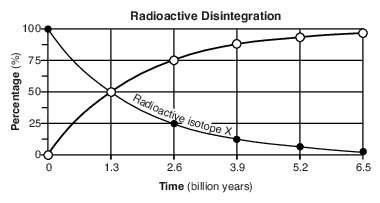
    On the grid in the image provided, construct a line graph by plotting the percentages of disintegration product Z forming over 6.5 billion years. Connect all six plots with a line. The percentages of radioactive isotope X have already been plotted. [1]

    earth-history, earth-history, radioactive-isotopes-dating, standard-1-math-and-science-inquery, velocity-slope-sediment-size-channel-shape-stream-valume-distance-from-the-sun-gravitational-force-period-of-revolution-speed-of-revolution, standard-6-interconnectedness, patterns-of-change fig: esci62019-ansbkw_abkq1.png

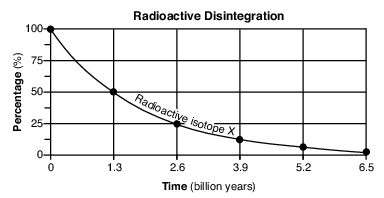
    Allow 1 credit if the centers of all six plots are within or touch the circles shown and are correctly connected with a line that passes within or touches each circle.

    • Note: Allow credit if the student-drawn line does not pass through the student plots, but is still

    • within or touches the circles. It is recommended that an overlay of the same scale as the student answer booklet be used to ensure reliability in rating.

    earth-history, earth-history, radioactive-isotopes-dating, standard-1-math-and-science-inquery, velocity-slope-sediment-size-channel-shape-stream-valume-distance-from-the-sun-gravitational-force-period-of-revolution-speed-of-revolution, standard-6-interconnectedness, patterns-of-change fig: esci62019-rg_g1.png

    Base your answers to questions 15 on the cross sections below and on your knowledge of Earth science. The cross sections represent three bedrock outcrops, 1, 2, and 3, found several kilometers apart.

    X The geologic time period when each sedimentary rock layer formed is shown. The symbols ( , , , , and ) represent fossils of different types of organisms present in the rock layers.

    geologic-history, reference-tables, earth-history, earth-history, relative-age-and-sequence-of-rock-strata, standard-1-math-and-science-inquery, changing-length-of-a-shadow-based-on-the-motion-of-the-sun, standard-6-interconnectedness, models fig: esci82013-exam_g31.png

    15

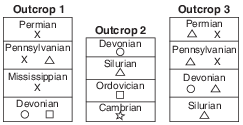
    Explain why the geologic age of these rock layers could not be accurately dated using carbon-14. [1]

    Allow 1 credit. Acceptable responses include, but are not limited to:

    • — Carbon-14 has a short half-life.

    • — These rock layers are too old to contain measurable carbon-14.

    • — Carbon-14 is used to date recent remains.

    • — No organic material remains in the rock.