Earth Science worksheet
    Topic: Relationship Of Transported Particle Size To Water Velocity
    Relationship Of Transported Particle Size To Water Velocity
    1

    A river’s current carries sediments into the ocean. Which sediment size will most likely be deposited in deeper water farthest from the shore?

    (1) pebble

    (2) sand

    (3) silt

    (4) clay

    2

    The minimum stream velocity necessary to transport a sediment particle that is 0.1 centimeter in diameter is closest to

    (1) 0.1 cm/s

    (2) 0.002 cm/s

    (3) 5.5 cm/s

    (4) 10.0 cm/s

    3

    What is the minimum water velocity necessary to maintain movement of 0.1-centimeter-diameter particles in a stream?

    (1) 0.02 cm/s

    (2) 0.5 cm/s

    (3) 5.0 cm/s

    (4) 20.0 cm/s

    Base your answers to questions 4 on the cross section and data table below and on your knowledge of Earth science. The cross section shows the profile of a stream that is flowing down a valley from its source. Points A through E represent locations in the stream. The data table shows the average stream velocity at each location. The volume of water in the stream remains the same at all locations.

    landscapes, erosion-and-natural-agents-of-erosion, standard-6-interconnectedness, patterns-of-change fig: esci12017-examw_g26.png

    landscapes, erosion-and-natural-agents-of-erosion, standard-6-interconnectedness, patterns-of-change fig: esci12017-examw_g27.png

    4

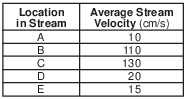
    What is the largest type of sediment that could be transported at location B?

    (1) silt

    (2) sand

    (3) pebbles

    (4) cobbles

    5

    Which particles most likely will be deposited fi rst as the velocity of a stream carrying a mixture of particles decreases?

    (1) small, fl at, low-density particles

    (2) small, round, low-density particles

    (3) large, fl at, high-density particles

    (4) large, round, high-density particles

    Base your answers to questions 6 on the photograph below and on your knowledge of Earth science. The photograph shows a sandstone erosional feature that formed near the Grand Canyon, in southwestern United States.

    landscapes, erosion-and-natural-agents-of-erosion, standard-1-math-and-science-inquery, geocentric-model-heliocentric-model fig: esci62019-examw_g35.png

    6

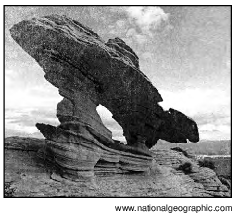
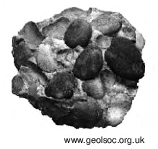
    What is the range of grain sizes that are most commonly found in rock making up this feature?

    (1) 0.0004 cm – 0.006 cm

    (2) 0.006 cm – 0.2 cm

    (3) 0.2 cm – 6.4 cm

    (4) 6.4 cm – 25.6 cm

    Base your answers to questions 7 on the cross sections below, which represent a particular location of the channel of the San Juan River in Utah. Changes in river discharge (Q), in cubic meters per second, and sediment deposits before, during, and after a flood are shown.

    landscapes, erosion-and-natural-agents-of-erosion, standard-6-interconnectedness, models, standard-6-interconnectedness, patterns-of-change fig: esci82012-examw_g43.png

    7

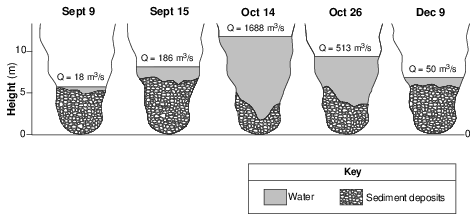
    If the greatest velocity of the San Juan River on December 9 was 10 centimeters per second, what was the approximate diameter of the largest particles that the river could have carried?

    (1) 1.0 cm

    (2) 2.0 cm

    (3) 10.0 cm

    (4) 0.2 cm

    Base your answers to questions 8 on the diagram and data table below and on your knowledge of Earth science. The diagram represents laboratory materials used for an investigation of the effects of particle diameter on permeability and porosity (percentage of pore space). Four separate plastic tubes were filled to the same level with different particles.

    landscapes, water-recycle, meteorology, water-cycles, standard-1-math-and-science-inquery, geocentric-model-heliocentric-model fig: esci62018-examw_g58.png

    landscapes, water-recycle, meteorology, water-cycles, standard-1-math-and-science-inquery, geocentric-model-heliocentric-model fig: esci62018-examw_g57.png

    8

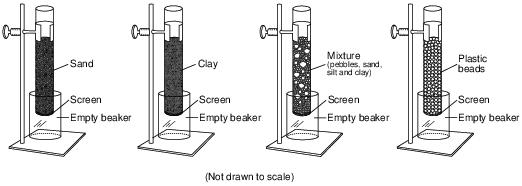
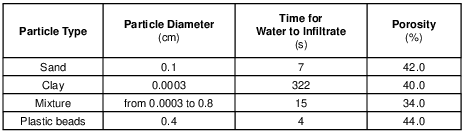
    Based on the particle diameter of the plastic beads, identify the type of sediment represented by these beads. [1]

    Allow 1 credit for pebbles.

    Base your answers to questions 9 on the map below and on your knowledge of Earth science. The map shows the location of Sandy Creek, west of Rochester, New York. X and Y represent points on the banks of the stream.

    landscapes, erosion-and-natural-agents-of-erosion, standard-6-interconnectedness, models, standard-6-interconnectedness, patterns-of-change fig: esci62013-examw_g49.png

    9

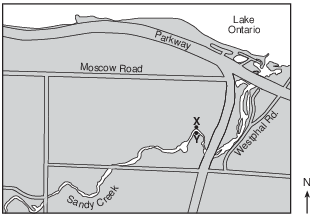
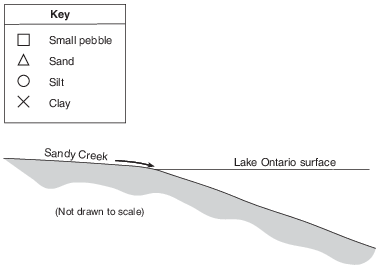
    The symbols representing four sediment particles are shown in the key in the image below. These particles are being transported by Sandy Creek into Lake Ontario. On the cross section in the image provided, draw the symbols on the bottom of Lake Ontario to show the relative position where each sediment particle is most likely deposited. [1]

    reference-tables, relationship-of-transported-particle-size-to-water-velocity, landscapes, erosion-and-natural-agents-of-erosion, standard-6-interconnectedness, patterns-of-change fig: esci62013-ansbk_abkq2.png

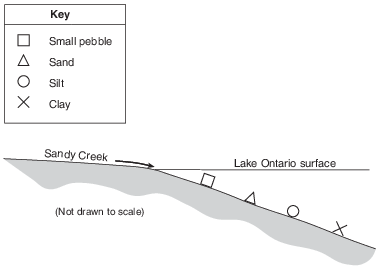
    Allow 1 credit if the relative positions of the symbols or particle names are in the order shown.

    • Example of a 1-credit response:

    reference-tables, relationship-of-transported-particle-size-to-water-velocity, landscapes, erosion-and-natural-agents-of-erosion, standard-6-interconnectedness, patterns-of-change fig: esci62013-rg_g1.png

    Base your answers to questions 10 on the diagram below and on your knowledge of Earth science. The diagram represents several streams converging and eventually flowing into a lake. Points X and Y indicate locations on either side of a meander in the stream. Points A and B indicate locations in the streams where the stream discharge was measured in cubic meters per second. The circled region labeled C represents a depositional feature.

    landscapes, patterns-of-deposition-and-formation-of-sedimentary-rocks, standard-6-interconnectedness, models fig: esci62019-examw_g42.png

    10

    The stream velocity at location A is 100 centimeters per second, and the stream velocity at location B is10 centimeters per second. Identify one possible particle diameter that would most likely be deposited

    between points A and B. [1]

    cm

    Allow 1 credit for any value from 0.18 cm to 2.5 cm.

    Base your answers to questions 11 on the photograph below and on your knowledge of Earth science. The photograph is of a rock sample composed of pebbles that have been cemented together.

    rocks-and-minerals, formation-classification-and-application-of-rocks, standard-1-math-and-science-inquery, changing-length-of-a-shadow-based-on-the-motion-of-the-sun, standard-6-interconnectedness, models fig: esci82019-examw_g28.png

    11

    Identify the total possible range of particle diameters, in centimeters, for a particle to be classified as a pebble. [1]

    The range is from _____________ cm to _____________ cm.

    Allow 1 credit for 0.2 cm to 6.4 cm.

    Base your answers to questions 12 on the graph below and on your knowledge of Earth science. The graph shows the discharge of the Delaware River at Barryville, New York, for a one-week period during March 2004.

    landscapes, erosion-and-natural-agents-of-erosion, standard-6-interconnectedness, models fig: esci82019-examw_g31.png

    12

    State one possible cause for the increase in stream discharge on March 15. [1]

    Allow 1 credit. Acceptable responses include, but are not limited to:

    • — precipitation

    • — rain shower

    • — snowmelt

    • — increased runoff

    • — flooding

    • — increase in the volume of water in the stream

    • Note: Do not allow credit for “velocity of water” or “increase in water velocity” because water

    • velocity is a result of an increase in water volume or discharge.

    Base your answers to questions 13 on the map and table below and on your knowledge of Earth science. The map shows the area where the Battenkill River flows into the Hudson River north of Albany, New York. Point A indicates a location within the Battenkill River. The table shows the densities of four common minerals found in Hudson River sediments.

    reference-tables, relationship-of-transported-particle-size-to-water-velocity, landscapes, erosion-and-natural-agents-of-erosion, standard-1-math-and-science-inquery, changing-length-of-a-shadow-based-on-the-motion-of-the-sun fig: esci12016-examw_g48.png

    13

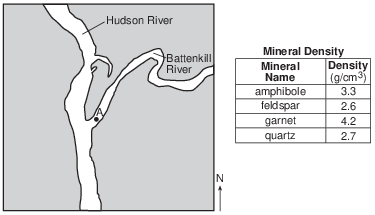
    Identify the diameter of the largest particle that would be carried at point A when the velocity of the Battenkill River is 50 cm/s. [1]

    cm

    Allow 1 credit for any value from 0.8 cm to 1.1 cm.

    Base your answers to questions 14 on the topographic map in image provided and on your knowledge of Earth science. Lines AB and CD are reference lines on the map. Letter E indicates a location in a stream.
    14

    Determine the velocity of the stream at location E where the largest particle being carried at location E has a diameter of 10.0 centimeters. [1]

    cm/s

    Allow 1 credit for any value from 150 cm/s to 250 cm/s.

    Base your answers to questions 15 on the passage and map below and on your knowledge of Earth science. The map shows a portion of the Dust Bowl in the southern Great Plains.

    The Dust Bowl

    In the 1930s, several years of drought affected over 100 million acres in the Great Plains from North Dakota to Texas. For several decades before this drought, farmers had plowed the prairie and loosened the soil. When the soil became extremely dry from lack of rain, strong prairie winds easily removed huge amounts of soil from the farms, forming dust storms. This region was called the Dust Bowl.

    In the spring of 1934, a windstorm lasting a day and a half created a dust cloud nearly 2000 kilometers long and caused “muddy rains” in New York State and “black snow” in Vermont. Months later, a Colorado storm carried dust approximately3 kilometers up into the atmosphere and transported it 3000 kilometers, creating

    twilight conditions at midday in New York State.

    climate, climate-alterd-by-natural-events-and-human-influences, standard-1-math-and-science-inquery, changing-length-of-a-shadow-based-on-the-motion-of-the-sun, standard-6-interconnectedness, systems-thinking fig: esci82014-examw_g43.png

    15

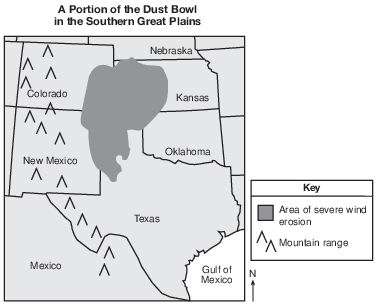
    Explain why the dust clouds that moved to the east coast of the United States during the 1934 storm were composed mostly of silt and clay particles instead of sand. [1]

    Allow 1 credit. Acceptable responses include, but are not limited to:

    • — The velocity of the wind could carry only small/less dense/flatter particles.

    • — Sand is heavier and not likely to be carried that far.

    • — The velocity of the wind was not great enough to carry sand particles.

    • — Smaller particles are eroded more easily.

    • — Silt and clay are smaller-sized particles.