Earth Science worksheet
    Topic: Stars
    Stars
    1

    Which star type has a surface temperature of4000 K and a luminosity 1000 times greater than

    the Sun?

    (1) dwarf

    (2) main sequence

    (3) giant

    (4) supergiant

    2

    Which star is cooler and less luminous than the Sun?

    (1) Proxima Centauri

    (2) Pollux

    (3) Rigel

    (4) 40 Eridani B

    Base your answers to questions 3 on the diagram below. The diagram represents the inferred stages in the formation of our solar system. Stage 1 shows a contracting gas cloud. The remaining stages show the gas cloud flattening into a spinning disk as planets formed around our Sun.

    seasons-and-astronomy, stars, seasons-and-astronomy, gravity, standard-1-math-and-science-inquery, geocentric-model-heliocentric-model fig: esci12012-examw_g30.png

    3

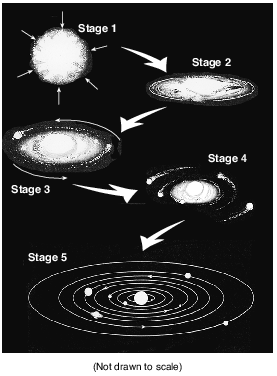
    Which force was mostly responsible for the contraction of the gas cloud?

    (1) friction

    (2) gravity

    (3) magnetism

    (4) inertia

    Base your answers to questions 4 on the diagram below, which shows the change in the size of a star such as our Sun as it evolves from a protostar to a white dwarf star.

    seasons-and-astronomy, stars, standard-6-interconnectedness, models fig: esci12013-exam_g19.png

    4

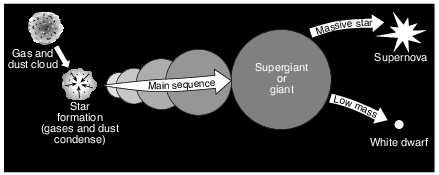
    During which stage of development does the star have a cool surface temperature and the greatest luminosity?

    (1) protostar

    (2) main sequence

    (3) giant

    (4) white dwarf

    Base your answers to questions 5 on the diagram below and on your knowledge of Earth science. The diagram represents the inferred changes to the luminosity and color of the Sun throughout its life cycle. The diagonal dashed line represents the main sequence stars. The numbers 1 through 5 represent stages in the life cycle of the Sun.

    seasons-and-astronomy, stars, standard-6-interconnectedness, models fig: esci12014-examw_g28.png

    5

    The Sun is inferred to spend the greatest amount of time in its life cycle

    (1) contracting from a gas cloud (nebula)

    (2) as a main sequence star

    (3) moving away from the main sequence and becoming a giant star

    (4) changing from a giant star to a white dwarf star

    6

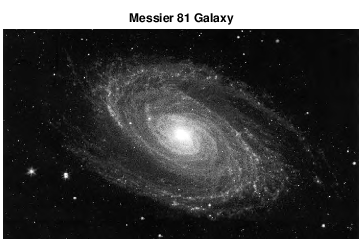
    The photograph below shows a feature of the universe as seen through a telescope.

    seasons-and-astronomy, stars, standard-6-interconnectedness, models fig: esci12015-examw_g2.png

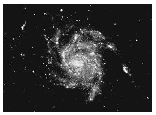
    This feature is best identified as

    (1) a galaxy

    (2) a comet

    (3) an asteroid

    (4) a star

    Base your answers to questions 7 on the cross-sectional model below and the table on the following page, and on your knowledge of Earth science. The model shows a reddish-orange supergiant star. The layers in the model indicate where new chemical elements are forming from existing elements as temperature and pressure conditions increase with depth within the star. In each layer, atomic nuclei of the existing chemical element combine to form the new elements shown to the right of the arrow. The table shows the chemical symbols and names of selected elements in the star.

    seasons-and-astronomy, stars, standard-1-math-and-science-inquery, changing-length-of-a-shadow-based-on-the-motion-of-the-sun, standard-6-interconnectedness, models fig: esci12016-examw_g38.png

    seasons-and-astronomy, stars, standard-1-math-and-science-inquery, changing-length-of-a-shadow-based-on-the-motion-of-the-sun, standard-6-interconnectedness, models fig: esci12016-examw_g39.png

    7

    Which process represented in the model is occurring in each layer of this star to produce the new chemical elements?

    (1) contact metamorphism

    (2) internal crystallization

    (3) nuclear fusion

    (4) radioactive decay

    8

    The diagram below represents a model of the size of the Sun and indicates the color of the Sun.

    reference-tables, characteristics-of-stars, seasons-and-astronomy, stars, standard-1-math-and-science-inquery, changing-length-of-a-shadow-based-on-the-motion-of-the-sun, standard-6-interconnectedness, models, standard-6-interconnectedness, magnitude-and-scale fig: esci12017-examw_g13.png

    Which diagram best represents the relative size and indicates the color of Polaris compared to the Sun?
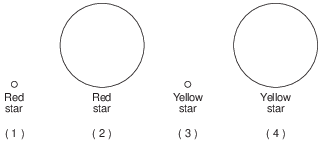
    reference-tables, characteristics-of-stars, seasons-and-astronomy, stars, standard-1-math-and-science-inquery, changing-length-of-a-shadow-based-on-the-motion-of-the-sun, standard-6-interconnectedness, models, standard-6-interconnectedness, magnitude-and-scale fig: esci12017-examw_g14.png

    (1) 1

    (2) 2

    (3) 3

    (4) 4

    Base your answers to questions 9 on the diagram below and on your knowledge of Earth science. The diagram represents the inferred origin and evolution of most stars.

    seasons-and-astronomy, stars, seasons-and-astronomy, gravity, standard-1-math-and-science-inquery, geocentric-model-heliocentric-model fig: esci12020-examw_g24.png

    9

    What causes the gas and dust cloud to condense and become a star?

    (1) density

    (2) friction

    (3) gravity

    (4) outgassing

    Base your answers to questions 10 on the diagram below and on your knowledge of Earth science. The diagram represents the present position of our solar system in a side view of the Milky Way Galaxy. The distance across the Milky Way Galaxy is measured in light-years.

    seasons-and-astronomy, stars, standard-6-interconnectedness, models fig: esci12014-examw_g35.png

    10

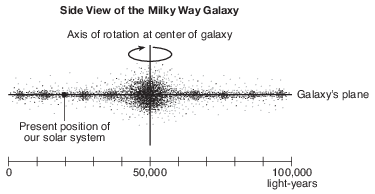
    What is the distance, in light-years, from the center of the Milky Way Galaxy to our solar system? [1]

    light-years

    Allow 1 credit for any value from 25,000 light-years to 35,000 light-years.

    Base your answers to questions 11 on the Characteristics of Stars graph in image provided and on your knowledge of Earth science.
    11

    The star Canopus has a surface temperature of 7400 K and a luminosity (relative to the Sun) of 1413. In your answer booklet, use an X to plot the position of Canopus on the graph, based on its surface temperature and luminosity. [1]

    reference-tables, characteristics-of-stars, seasons-and-astronomy, stars, standard-1-math-and-science-inquery, eccentricity-rate-gradient-standard-error, standard-1-math-and-science-inquery, changing-length-of-a-shadow-based-on-the-motion-of-the-sun, standard-6-interconnectedness, models fig: esci12015-ansbk_abkq9.png

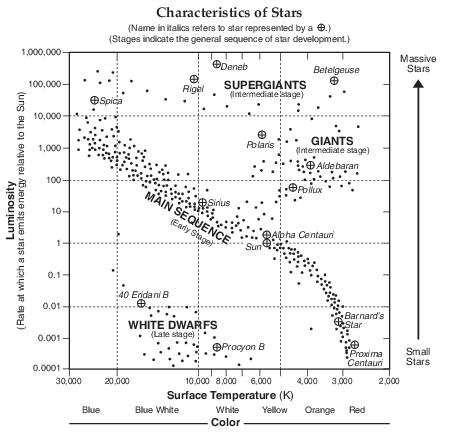
    Allow 1 credit if the center of the X is placed within or touches the box shown below.

    • Note: Allow credit if a symbol other than an X is used.

    • It is recommended that an overlay of the same scale as the student answer booklet be used to ensure reliability in rating.

    reference-tables, characteristics-of-stars, seasons-and-astronomy, stars, standard-1-math-and-science-inquery, eccentricity-rate-gradient-standard-error, standard-1-math-and-science-inquery, changing-length-of-a-shadow-based-on-the-motion-of-the-sun, standard-6-interconnectedness, models fig: esci12015-rg_g8.png

    Base your answers to questions 12 on the diagram below and on your knowledge of Earth science. The diagram represents a model of the expanding universe.

    seasons-and-astronomy, big-bang, standard-1-math-and-science-inquery, geocentric-model-heliocentric-model fig: esci12017-examw_g28.png

    12

    Identify the nuclear process that combines lighter elements into heavier elements to produce the energy radiated by stars. [1]

    Allow 1 credit for fusion or nuclear fusion.

    Base your answers to questions 13 on the passage and the Characteristics of Stars graph below, and your knowledge of Earth science. Letters A, B, and C represent main sequence stars on the graph. The giant star Aldebaran is also shown.

    Globular Star Clusters

    Globular star clusters appear as small, hazy spots among the other stars. These clusters are groups of hundreds of thousands of stars held together by gravity. Individual stars within a cluster can be seen by using powerful telescopes, allowing scientists to determine their luminosities and temperatures.

    All of the stars in a given cluster formed at the same time. In young clusters, most of the stars are classified as main sequence stars. As the stars in a cluster age, they eventually use up their core hydrogen and expand, changing from main sequence stars to giants. The most massive main sequence stars become supergiants. The less massive a star is in the cluster, the longer it remains a main sequence star. Over time, the number of main sequence stars in a cluster decreases.

    seasons-and-astronomy, stars, standard-1-math-and-science-inquery, geocentric-model-heliocentric-model, standard-1-math-and-science-inquery, changing-length-of-a-shadow-based-on-the-motion-of-the-sun, standard-6-interconnectedness, systems-thinking fig: esci12018-examw_g49.png

    13

    Compared to the relative amount of time that star A remains in the main sequence, state how the relative amount of time that star C remains in the main sequence is different. Explain why this amount of time is different. [1]

    Relative time for star C: Explanation:

    Allow 1 credit if both responses are correct. Acceptable responses include, but are not limited to:

    • Relative time for star C:

    • — stays in main sequence longer

    • — greater amount of time/more time

    • — Star A leaves the main sequence sooner.

    • Explanation:

    • — Star C is less massive/smaller.

    • — It is cooler.

    • — Star C uses up its core hydrogen more slowly.

    • — Star A is more massive/larger.

    • — The less massive a star is in the cluster, the longer it remains a main sequence star.

    Base your answers to questions 14 on the diagram and photograph below and on your knowledge of Earth science. The diagram represents the constellation Ursa Major. One star, Phecda, has been labeled. Letter X represents the location of the Messier 81 galaxy (M81), which can be observed near Ursa Major. The photograph shows the Messier 81 galaxy as viewed through a telescope.

    seasons-and-astronomy, stars, standard-1-math-and-science-inquery, velocity-slope-sediment-size-channel-shape-stream-valume-distance-from-the-sun-gravitational-force-period-of-revolution-speed-of-revolution, standard-1-math-and-science-inquery, changing-length-of-a-shadow-based-on-the-motion-of-the-sun fig: esci12019-examw_g45.png

    seasons-and-astronomy, stars, standard-1-math-and-science-inquery, velocity-slope-sediment-size-channel-shape-stream-valume-distance-from-the-sun-gravitational-force-period-of-revolution-speed-of-revolution, standard-1-math-and-science-inquery, changing-length-of-a-shadow-based-on-the-motion-of-the-sun fig: esci12019-examw_g46.png

    14

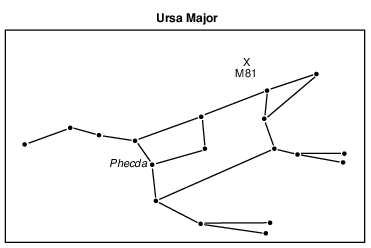
    Phecda has a surface temperature of approximately 9500 K and a luminosity of 63. Identify the name of the star found on the Characteristics of Stars chart in the 2011 Edition Reference Tables for Physical Setting/ Earth Science that has a surface temperature and luminosity closest to Phecda. [1]

    Allow 1 credit for Sirius.

    Base your answers to questions 15 on the information and data table below and on your knowledge of Earth science. The table shows data for the six planets in the Kepler-11 star system.

    Kepler-11 is one of many star systems discovered by space satellites. Scientists find this system unusual because of its small size and its six planets, identified by letters b through g, that orbit relatively close to its central star. The central star, Kepler-11, has a surface temperature of 5663 K and a luminosity of 1.0.

    seasons-and-astronomy, the-solar-system, standard-1-math-and-science-inquery, velocity-slope-sediment-size-channel-shape-stream-valume-distance-from-the-sun-gravitational-force-period-of-revolution-speed-of-revolution fig: esci12020-examw_g43.png

    15

    Identify the star located on the Characteristics of Stars graph on the Physical Setting/Earth Science Reference Tables that has the most similar surface temperature and luminosity as the Kepler-11 star. [1]

    Allow 1 credit for the Sun.