Earth Science worksheet
    Topic: Storms And Severe Weather
    Storms And Severe Weather
    1

    Which map below shows the most likely storm track for a hurricane (meteorology, presentation-of-weather-data, meteorology, weather-basics-and-observable-patterns, meteorology, storms-and-severe-weather, standard-6-interconnectedness, models fig: esci12012-examw_g11.png) in the Atlantic Ocean?

    meteorology, presentation-of-weather-data, meteorology, weather-basics-and-observable-patterns, meteorology, storms-and-severe-weather, standard-6-interconnectedness, models fig: esci12012-examw_g10.png

    (1) 1

    (2) 2

    (3) 3

    (4) 4

    2

    Most tornadoes in the Northern Hemisphere are best described as violently rotating columns of air surrounded by

    (1) clockwise surface winds moving toward the columns

    (2) clockwise surface winds moving away from the columns

    (3) counterclockwise surface winds moving toward the columns

    (4) counterclockwise surface winds moving away from the columns

    3

    In the Northern Hemisphere, surface winds around the center of a hurricane move

    (1) clockwise and inward

    (2) clockwise and outward

    (3) counterclockwise and inward

    (4) counterclockwise and outward

    4

    Most of the hurricanes that affect the east coast of the United States originally form over the

    (1) warm waters of the Atlantic Ocean in summer

    (2) warm land of the southeastern United States in summer

    (3) cool waters of the Atlantic Ocean in spring

    (4) cool land of the southeastern United States in spring

    5

    Boarding up windows would be one emergency action most likely taken to prepare for which natural disaster?

    (1) earthquake

    (2) hurricane

    (3) flood

    (4) tsunami

    6

    The leading edge of a thunderstorm reached Elmira, New York, at 1:00 p.m. This thunderstorm was moving eastward at 45 miles per hour. The leading edge of the thunderstorm most likely reached Binghamton, New York, at approximately

    (1) 1:00 p.m.

    (2) 2:00 p.m.

    (3) 12:00 p.m.

    (4) 4:00 p.m.

    Base your answers to questions 7 on the weather map below and on your knowledge of Earth science. The map of a portion of eastern North America shows a high-pressure center (H) and a low-pressure center (L), frontal boundaries, and present weather conditions.

    reference-tables, key-to-weather-map-symbols, meteorology, weather-basics-and-observable-patterns, meteorology, front, meteorology, storms-and-severe-weather, standard-1-math-and-science-inquery, changing-length-of-a-shadow-based-on-the-motion-of-the-sun, standard-6-interconnectedness, models fig: esci82014-examw_g34.png

    7

    Which weather condition is shown along the cold front?

    (1) fog

    (2) snow

    (3) haze

    (4) thunderstorms

    Base your answers to questions 8 on the data table below, the map on the following page, and on your knowledge of Earth science. The data table shows the air pressure in the eye (center) and the maximum sustained wind speed around the eye of Hurricane Wilma from October 18 through October 25, 2005. The data were collected at the same time each day. The map shows the geographic locations of the eye of Hurricane Wilma from October 18 to October 25.

    maps-and-measurement, latitude-and-longitude, standard-6-interconnectedness, models fig: esci12014-examw_g31.png

    maps-and-measurement, latitude-and-longitude, standard-6-interconnectedness, models fig: esci12014-examw_g32.png

    8

    State the compass direction in which Hurricane Wilma moved from October 22 through October 25. [1]

    Allow 1 credit for NE or northeast or northeastward or for indicating slightly east of northeast.
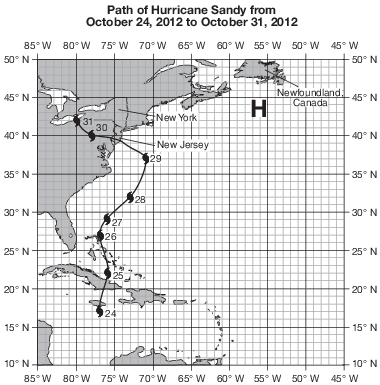
    Base your answers to questions 9 on the passage and map below and on your knowledge of Earth science. The map shows the positions of the eye (center) of Hurricane Sandy in its path from October 24 to October 31, 2012. A high-pressure center (H) is shown on the map.

    Hurricane Sandy

    In October 2012, Hurricane Sandy produced extreme damage to New York City and the coast of New Jersey due to high winds and a high storm surge. A storm surge is the rise in the level of ocean water along a coast that is caused by strong winds blowing toward land from a severe storm. High ocean tides, occurring at the same time, added to the height of the storm surge. A high-pressure center, located just south of Newfoundland, Canada, affected Hurricane Sandy by altering the path of the jet stream. This change in the jet stream, combined with surface wind circulation around the high-pressure center, caused Hurricane Sandy to curve westward, making landfall along the coast of New Jersey.

    maps-and-measurement, latitude-and-longitude, standard-1-math-and-science-inquery, velocity-slope-sediment-size-channel-shape-stream-valume-distance-from-the-sun-gravitational-force-period-of-revolution-speed-of-revolution fig: esci12017-examw_g30.png

    9

    The data table below shows the air pressure, measured in millibars (mb), and surface wind speed, measured in miles per hour (mi/h), recorded near the center of Hurricane Sandy on three separate days.

    meteorology, weather-basics-and-observable-patterns, meteorology, weather-variables, meteorology, storms-and-severe-weather, standard-1-math-and-science-inquery, velocity-slope-sediment-size-channel-shape-stream-valume-distance-from-the-sun-gravitational-force-period-of-revolution-speed-of-revolution fig: esci12017-examw_g31.png

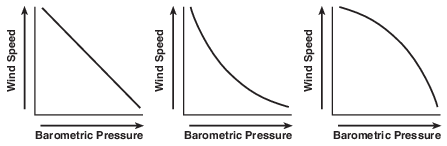
    On the set of axes in the image below, draw a line to represent the general relationship between air pressure and surface wind speed associated with Hurricane Sandy for these three days. [1]

    meteorology, weather-basics-and-observable-patterns, meteorology, weather-variables, meteorology, storms-and-severe-weather, standard-1-math-and-science-inquery, velocity-slope-sediment-size-channel-shape-stream-valume-distance-from-the-sun-gravitational-force-period-of-revolution-speed-of-revolution fig: esci12017-ansbk_abkq1.png

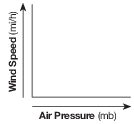
    Allow 1 credit for a line showing that, generally, as air pressure increases, wind speed decreases.

    • Examples of 1-credit responses:

    meteorology, weather-basics-and-observable-patterns, meteorology, weather-variables, meteorology, storms-and-severe-weather, standard-1-math-and-science-inquery, velocity-slope-sediment-size-channel-shape-stream-valume-distance-from-the-sun-gravitational-force-period-of-revolution-speed-of-revolution fig: esci12017-rg_g1.png

    Base your answers to questions 10 on the data table below, on the map in image provided, and on your knowledge of Earth science. The table lists storm data for Hurricane Matthew, which occurred in the fall of 2016. Air pressure, wind speed, and storm location are shown for the hurricane’s center at the same time each day. The map shows the location of Hurricane Matthew from September 28 to October 4.

    meteorology, presentation-of-weather-data, meteorology, weather-variables, standard-1-math-and-science-inquery, eccentricity-rate-gradient-standard-error fig: esci12020-examw_g41.png

    10

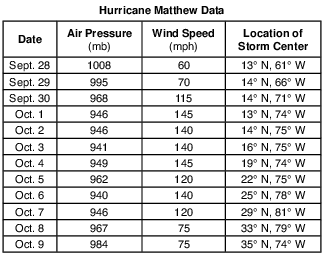
    The table below shows the Saffir-Simpson Scale, which is used to classify hurricanes.

    meteorology, weather-basics-and-observable-patterns, meteorology, storms-and-severe-weather, standard-1-math-and-science-inquery, velocity-slope-sediment-size-channel-shape-stream-valume-distance-from-the-sun-gravitational-force-period-of-revolution-speed-of-revolution, standard-6-interconnectedness, models fig: esci12020-examw_g40.png

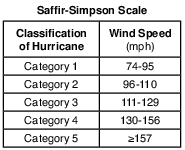
    Identify the greatest wind speed of Hurricane Matthew listed on the data table, and identify the classification of Hurricane Matthew based on this wind speed. [1]

    Wind speed: ________________________________ mph Classification of hurricane: _________________________________

    Allow 1 credit for a wind speed of 145 mph and a Category 4/Cat 4 classification of hurricane.

    Base your answers to questions 11 on the map below, which represents the geographic source regions of two air masses, X and Y. The arrows represent the convergence of these air masses, which may result in tornadoes.

    reference-tables, key-to-weather-map-symbols, meteorology, presentation-of-weather-data, standard-6-interconnectedness, models fig: esci62012-exam_w_g63.png

    11

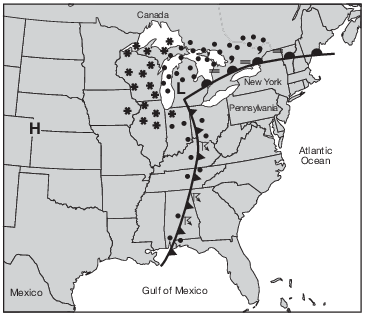
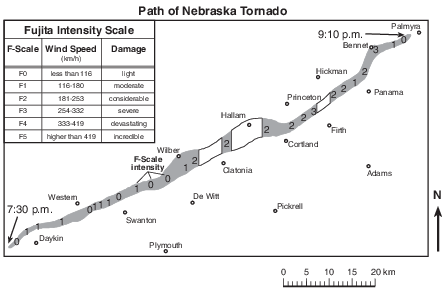
    A tornado watch or warning is issued for a location in the area labeled Tornado Alley. State one safety precaution that should be taken to avoid possible injury from this tornado. [1]

    Allow 1 credit. Acceptable responses include, but are not limited to:

    • — go to the basement

    • — stay away from windows

    • — listen to emergency warnings broadcast on radio or TV

    • — go to a community emergency shelter

    Base your answers to questions 12 on the data table below, on the map in image provided, and on your knowledge of Earth science. The data table shows the date, location, barometric pressure, and wind speed at the center of Hurricane Irma at 12 noon from September 7 through September 11, 2017. The map in image provided shows the latitude and longitude coordinates and a portion of the southeast United States and the Caribbean.

    maps-and-measurement, latitude-and-longitude, standard-1-math-and-science-inquery, eccentricity-rate-gradient-standard-error, standard-6-interconnectedness, models fig: esci62022-exam_g45.png

    12

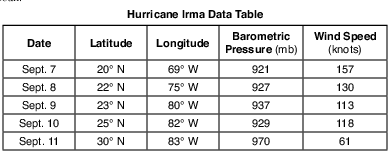
    Describe the general relationship between the barometric pressure and wind speed for Hurricane Irma. [1]

    Allow 1 credit. Acceptable responses include, but are not limited to:

    • — As barometric pressure increases, the wind speed decreases.

    • — The higher the wind speed, the lower the pressure.

    • — inverse relationship/negative relationship

    Base your answers to questions 13 on the Atlantic hurricane map below and on your knowledge of Earth science. The arrows on the map show the tracks of various hurricanes that occurred during late summer and early fall.

    meteorology, transfer-of-heat-energy, dynamic-earth, earth-energy-density-and-movement-of-plates, meteorology, transfer-of-heat-energy, meteorology, weather-basics-and-observable-patterns, climate, climate-of-a-location, meteorology, storms-and-severe-weather, standard-1-math-and-science-inquery, geocentric-model-heliocentric-model, standard-6-interconnectedness, systems-thinking fig: esci82014-examw_g46.png

    13

    Describe one ocean surface condition or atmospheric condition that makes the area over the Atlantic Ocean between 10° N latitude and 20° N latitude ideal for these hurricanes to form. [1]

    Allow 1 credit. Acceptable responses include, but are not limited to:

    • — The warm waters that give the hurricane its energy are located in this tropical region of the

    • ocean.

    • — Warm ocean waters between 10° N and 20° N fuel hurricanes.

    • — Warm and/or humid atmospheric conditions exist between 10° N and 20° N.

    • — a maritime tropical air mass

    • — low air pressure

    • — rising air currents

    • — low wind shear

    Base your answers to questions 14 on the map in image provided and on your knowledge of Earth science. The map shows the path of a tornado that moved through a portion of Nebraska on May 22, 2004 between 7:30 p.m. and 9:10 p.m. The path of the tornado along the ground is indicated by the shaded region. The width of the shading indicates the width of destruction on the ground. Numbers on the tornado’s path indicate the Fujita intensity at those locations. The Fujita Intensity Scale (F-Scale), in the left corner of the map, provides information about wind speed and damage at various F-Scale intensities.
    14

    On the map in the image provided, place an X at a location where the tornado damage was greatest. [1]

    meteorology, weather-basics-and-observable-patterns, meteorology, storms-and-severe-weather, standard-6-interconnectedness, models fig: esci82015-ansbkt_abkq7.png

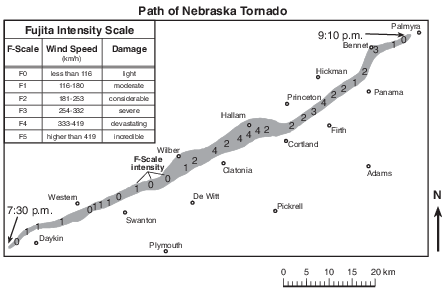
    Allow 1 credit if the center of the X is within or touches any of the clear areas along the path of the tornado shown below.

    • Note: It is recommended that an overlay of the same scale as the student answer booklet be used

    • to ensure reliability in rating.

    meteorology, weather-basics-and-observable-patterns, meteorology, storms-and-severe-weather, standard-6-interconnectedness, models fig: esci82015-rg_g6.png

    Base your answers to questions 15 on the data table below, on the map in image provided, and on your knowledge of Earth science. The data table shows latitude and longitude locations of the center of Hurricane Odile recorded at the same time each day from September 12 to September 18, 2014. The data table also shows the hurricane’s barometric pressure in millibars (mb) and wind speed in knots (kt). The location of La Paz, Mexico, is indicated on the map.

    meteorology, presentation-of-weather-data, standard-1-math-and-science-inquery, eccentricity-rate-gradient-standard-error, standard-6-interconnectedness, models fig: esci82017-examw_g58.png

    15

    Using the set of axes in the image provided, draw a line to represent the general relationship between barometric pressure and wind speed associated with Hurricane Odile. [1]

    meteorology, weather-basics-and-observable-patterns, meteorology, weather-variables, meteorology, storms-and-severe-weather, standard-1-math-and-science-inquery, eccentricity-rate-gradient-standard-error, standard-1-math-and-science-inquery, velocity-slope-sediment-size-channel-shape-stream-valume-distance-from-the-sun-gravitational-force-period-of-revolution-speed-of-revolution fig: esci82017-ansbk_abkq6.png

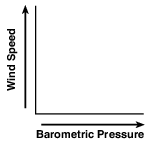
    Allow 1 credit for a line that shows a negative slope. Acceptable responses include, but are not limited to:

    • Examples of 1-credit responses:

    meteorology, weather-basics-and-observable-patterns, meteorology, weather-variables, meteorology, storms-and-severe-weather, standard-1-math-and-science-inquery, eccentricity-rate-gradient-standard-error, standard-1-math-and-science-inquery, velocity-slope-sediment-size-channel-shape-stream-valume-distance-from-the-sun-gravitational-force-period-of-revolution-speed-of-revolution fig: esci82017-rg_g7.png