Earth Science worksheet
    Topic: Test Sediment Properties And The Rate Of Deposition
    Test Sediment Properties And The Rate Of Deposition
    1

    Compared to the terrestrial planets, the Jovian planets are

    (1) larger and less dense

    (2) smaller and more dense

    (3) closer to the Sun and less rocky

    (4) farther from the Sun and more rocky

    2

    The cross sections below represent three beakers that were used to test porosity. Beakers A, B, and C each contain a different size of bead. Each beaker holds an equal volume of beads. The amount of water needed to fill the total pore space between the beads in each beaker was measured.

    landscapes, water-recycle, meteorology, water-cycles, standard-1-math-and-science-inquery, velocity-slope-sediment-size-channel-shape-stream-valume-distance-from-the-sun-gravitational-force-period-of-revolution-speed-of-revolution, standard-6-interconnectedness, models, standard-1-math-and-science-inquery, test-sediment-properties-and-the-rate-of-deposition fig: esci62015-exam_g7.png

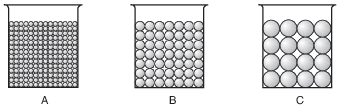
    Which statement best describes the porosity that was found for these three samples?

    (1) A had a greater porosity than B and C.

    (2) B had a greater porosity than A and C.

    (3) C had a greater porosity than A and B.

    (4) All three samples had the same porosity.

    3

    Sediment samples A through D below have the same volume and packing, but contain different percentages of various particle sizes.

    Sample A: 75% clay and 25% silt Sample B: 25% clay and 75% sand Sample C: 50% pebbles and 50% sand Sample D: 50% pebbles and 50% cobbles

    Which sample most likely has the greatest permeability?

    (1) A

    (2) B

    (3) C

    (4) D

    4

    The cross section below represents prevailing winds moving over a coastal mountain range. Letters A through D represent locations on Earth’s surface.

    meteorology, effect-of-vertical-atmospheric-movement, climate, climate-of-a-location, standard-1-math-and-science-inquery, test-sediment-properties-and-the-rate-of-deposition fig: esci82013-exam_g2.png

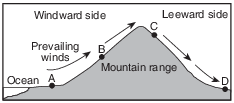
    Which location will most likely have the least annual precipitation?

    (1) A

    (2) B

    (3) C

    (4) D

    5

    The table below shows tide data for a location on the north shore of Long Island, in New York State.

    seasons-and-astronomy, tides, standard-6-interconnectedness, patterns-of-change, standard-1-math-and-science-inquery, test-sediment-properties-and-the-rate-of-deposition fig: esci82019-examw_g2.png

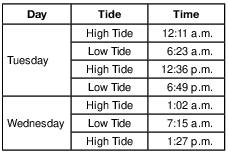
    Based on these data, what is the most likely time of the next high tide?

    (1) 1:53 a.m.

    (2) 1:53 p.m.

    (3) 7:40 a.m.

    (4) 7:40 p.m.

    Base your answers to questions 6 on the diagram below and on your knowledge of Earth science. The diagram represents three containers, A, B, and C, which have the same volume and are filled to the same level with uniform-sized beads. The beads are held in place by a screen across the bottom of each container.

    landscapes, water-recycle, meteorology, water-cycles, standard-1-math-and-science-inquery, eccentricity-rate-gradient-standard-error, standard-1-math-and-science-inquery, velocity-slope-sediment-size-channel-shape-stream-valume-distance-from-the-sun-gravitational-force-period-of-revolution-speed-of-revolution, standard-1-math-and-science-inquery, test-sediment-properties-and-the-rate-of-deposition fig: esci12020-examw_g32.png

    6

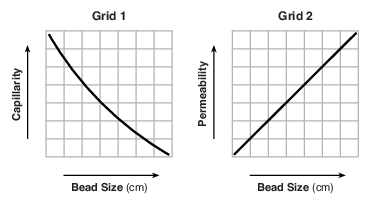
    Draw a line on grid 1 in the image below to show the general relationship between bead size and capillarity. Draw a line on grid 2 in the image provided to show the general relationship between bead size and permeability. [1]

    landscapes, water-recycle, meteorology, water-cycles, standard-1-math-and-science-inquery, eccentricity-rate-gradient-standard-error, standard-1-math-and-science-inquery, velocity-slope-sediment-size-channel-shape-stream-valume-distance-from-the-sun-gravitational-force-period-of-revolution-speed-of-revolution, standard-1-math-and-science-inquery, test-sediment-properties-and-the-rate-of-deposition fig: esci12020-ansbkw_abkq1.png

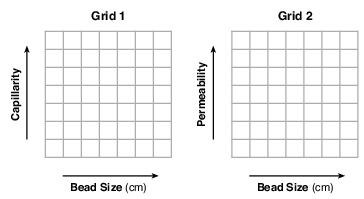
    Allow 1 credit for grid 1 showing an inverse relationship, and grid 2 showing a direct relationship.

    • Example of a 1-credit response:

    landscapes, water-recycle, meteorology, water-cycles, standard-1-math-and-science-inquery, eccentricity-rate-gradient-standard-error, standard-1-math-and-science-inquery, velocity-slope-sediment-size-channel-shape-stream-valume-distance-from-the-sun-gravitational-force-period-of-revolution-speed-of-revolution, standard-1-math-and-science-inquery, test-sediment-properties-and-the-rate-of-deposition fig: esci12020-rg_g1.png

    Base your answers to questions 7 on the block diagram below and on your knowledge of Earth science. The diagram represents a meandering stream flowing into the ocean. Points A and B represent locations along the streambanks. Letter C indicates a triangular-shaped depositional feature where the stream enters the ocean.

    landscapes, erosion-and-natural-agents-of-erosion, standard-6-interconnectedness, systems-thinking, standard-6-interconnectedness, models, standard-1-math-and-science-inquery, test-sediment-properties-and-the-rate-of-deposition fig: esci62015-exam_g38.png

    7

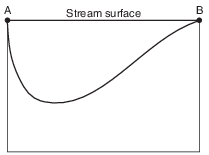
    The top of the box in the image provided represents the stream surface between points A and B. In the box, draw a line from point A to point B to represent a cross-sectional view of the shape of the bottom of the stream channel. [1]

    landscapes, erosion-and-natural-agents-of-erosion, standard-6-interconnectedness, systems-thinking, standard-6-interconnectedness, models, standard-1-math-and-science-inquery, test-sediment-properties-and-the-rate-of-deposition fig: esci62015-ansbk_abkq3.png

    Allow 1 credit if the student’s line is drawn from point A to point B and shows that the stream channel is deeper near side A.

    • Example of a 1-credit response:

    landscapes, erosion-and-natural-agents-of-erosion, standard-6-interconnectedness, systems-thinking, standard-6-interconnectedness, models, standard-1-math-and-science-inquery, test-sediment-properties-and-the-rate-of-deposition fig: esci62015-rg_g3.png

    Base your answers to questions 8 on the diagram below and on your knowledge of Earth science. The diagram represents several streams converging and eventually flowing into a lake. Points X and Y indicate locations on either side of a meander in the stream. Points A and B indicate locations in the streams where the stream discharge was measured in cubic meters per second. The circled region labeled C represents a depositional feature.

    landscapes, patterns-of-deposition-and-formation-of-sedimentary-rocks, standard-6-interconnectedness, models fig: esci62019-examw_g42.png

    8

    Describe how the size and shape of sediments will most likely change as they are transported downstream. [1]

    Size: Shape:

    Allow 1 credit for two correct responses. Acceptable responses include, but are not limited to:

    • Size:

    • — becomes smaller

    • — decrease

    • Shape:

    • — becomes more rounded

    • — less angular

    • — Sharp edges are worn down.

    • Note: Do not accept “smooth” for the shape of the sediments, because smooth does not describe

    • a shape but a texture.

    Base your answers to questions 9 on the passage, two diagrams, and table below and on your knowledge of Earth science. The passage describes a method used to mine gold and the diagrams represent two different views of a sluice box, which is used to separate gold from other sediments. The table shows the mineral characteristics of gold.

    Gold Mining

    A sluice box is used to remove gold pieces from other sediments in a stream. The box is placed in the stream to channel some of the water flow. Gold-bearing sediment is placed at the upper end of the box. The riffles in the bottom of the box are designed and positioned to create disruptions in the water flow. These disruptions cause dead zones in the current that allow the more dense gold to drop out of suspension and be deposited behind the riffles. Lighter material flows out of the box as tailings. Typically, particles of the mineral pyrite, which shares characteristics with gold, are deposited with gold particles in the sluice box. Since miners were fooled into thinking the nuggets of pyrite were gold, the name “fool’s gold” is often applied to pyrite.

    landscapes, erosion-and-natural-agents-of-erosion, standard-6-interconnectedness, models, standard-1-math-and-science-inquery, test-sediment-properties-and-the-rate-of-deposition fig: esci82016-examw_g41.png

    landscapes, erosion-and-natural-agents-of-erosion, standard-6-interconnectedness, models, standard-1-math-and-science-inquery, test-sediment-properties-and-the-rate-of-deposition fig: esci82016-examw_g43.png

    landscapes, erosion-and-natural-agents-of-erosion, standard-6-interconnectedness, models, standard-1-math-and-science-inquery, test-sediment-properties-and-the-rate-of-deposition fig: esci82016-examw_g42.png

    9

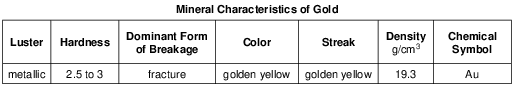
    Identify the characteristic of gold shown in the table that allows gold to be deposited behind the riffles, while other material flows out of the sluice box as tailings. [1]

    Allow 1 credit for density or high density or 19.3 g/cm3.

    Base your answers to questions 10 on the geologic cross section below and on your knowledge of Earth science. The cross section represents rock units, labeled A through K, that have not been overturned. Two unconformities and a volcanic ash layer are indicated.

    earth-history, earth-history, relative-age-and-sequence-of-rock-strata, standard-1-math-and-science-inquery, geocentric-model-heliocentric-model, standard-6-interconnectedness, models, standard-6-interconnectedness, patterns-of-change, standard-1-math-and-science-inquery, test-sediment-properties-and-the-rate-of-deposition fig: esci82018-examw_g49.png

    10

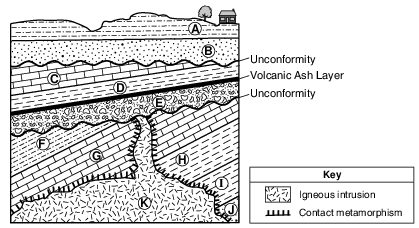
    List the letters E, H, and K to indicate the correct order of rock unit formation, from oldest to youngest, that formed this portion of Earth’s crust. [1]

    Letters: ___________, ___________,___________ Oldest --> Youngest

    Allow 1 credit for the sequence shown below:

    earth-history, earth-history, relative-age-and-sequence-of-rock-strata, standard-1-math-and-science-inquery, geocentric-model-heliocentric-model, standard-6-interconnectedness, models, standard-6-interconnectedness, patterns-of-change, standard-1-math-and-science-inquery, test-sediment-properties-and-the-rate-of-deposition fig: esci82018-rg2_g1.png

    Base your answers to questions 11 on the cross section below and on your knowledge of Earth science. Letters A through G identify rock units. Letter S identifi es a fault. Lines W, X, Y, and Z are unconformities. Index fossils are represented in two of the rock units, and a volcanic ash layer has been labeled. The rock units have not been overturned.

    earth-history, earth-history, processes-and-environment-when-rocks/fossils-form, standard-1-math-and-science-inquery, geocentric-model-heliocentric-model, standard-6-interconnectedness, models, standard-6-interconnectedness, patterns-of-change fig: esci82022-exam_g51.png

    11

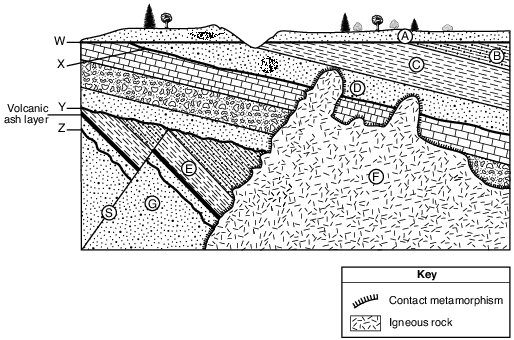
    In the blanks in the image provided, place the letters E, F, G, S, and Z in the correct order to represent the relative ages of these rock units and features, from oldest to youngest. [1]

    earth-history, earth-history, relative-age-and-sequence-of-rock-strata, standard-6-interconnectedness, models, standard-6-interconnectedness, patterns-of-change, standard-1-math-and-science-inquery, test-sediment-properties-and-the-rate-of-deposition fig: esci82022-answerbooklet_abkq6.png

    Allow 1 credit for the correct order shown below:

    earth-history, earth-history, relative-age-and-sequence-of-rock-strata, standard-6-interconnectedness, models, standard-6-interconnectedness, patterns-of-change, standard-1-math-and-science-inquery, test-sediment-properties-and-the-rate-of-deposition fig: esci82022-rg_g6.png