Earth Science worksheet
    Topic: Tides
    Tides
    1

    The graph below shows changing ocean tide heights in feet (ft) on April 7 for a coastal location.

    seasons-and-astronomy, tides, standard-1-math-and-science-inquery, velocity-slope-sediment-size-channel-shape-stream-valume-distance-from-the-sun-gravitational-force-period-of-revolution-speed-of-revolution fig: esci-v202-exam_g1.png

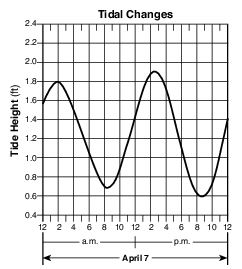
    The next high tide will occur on April 8 at approximately

    (1) 10 a.m.

    (2) 10 p.m.

    (3) 3 a.m.

    (4) 3 p.m.

    2

    Approximately which percentage of Earth’s surface is exposed above water?

    (1) 30%

    (2) 50%

    (3) 70%

    (4) 90%

    Base your answers to questions 3 on the graph below and on your knowledge of Earth science. The graph shows the tidal range (the difference between the highest tide and the lowest tide) recorded in Minas Basin, Nova Scotia, during November 2007. The phase of the Moon on selected days is shown above the graph. The dates that the Moon was farthest from Earth (apogee) and closest to Earth (perigee) are indicated under the graph.

    seasons-and-astronomy, motion-of-objects-in-the-solar-system, seasons-and-astronomy, tides, standard-1-math-and-science-inquery, velocity-slope-sediment-size-channel-shape-stream-valume-distance-from-the-sun-gravitational-force-period-of-revolution-speed-of-revolution, standard-6-interconnectedness, models fig: esci12014-examw_g29.png

    3

    The highest high tides and the lowest low tides occurred when the Moon was near

    (1) apogee and a new-Moon phase

    (2) apogee and a full-Moon phase

    (3) perigee and a new-Moon phase

    (4) perigee and a full-Moon phase

    4

    The diagram below represents eight positions of the Moon in its orbit.

    seasons-and-astronomy, tides, standard-6-interconnectedness, models fig: esci12016-examw_g4.png

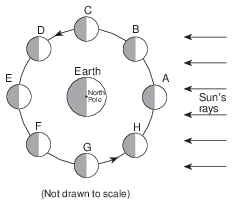
    Why are high tides on Earth greatest when the Moon is in position A and in position E?

    (1) The Moon is closer to the Sun.

    (2) The Moon is closer to Earth.

    (3) The Moon, the Sun, and Earth are aligned.

    (4) The Moon is in the same phase at both locations.

    5

    The hydrosphere covers approximately what percentage of Earth’s lithosphere?

    (1) 100%

    (2) 70%

    (3) 50%

    (4) 25%

    6

    The frequency of Earth’s cycle of ocean tides is primarily controlled by

    (1) Earth’s rotation and the Moon’s rotation

    (2) Earth’s rotation and the Moon’s revolution

    (3) Earth’s revolution and the Moon’s rotation

    (4) Earth’s revolution and the Moon’s revolution

    7

    The graph below shows the change in the heights of tides for two days.

    seasons-and-astronomy, tides, standard-1-math-and-science-inquery, velocity-slope-sediment-size-channel-shape-stream-valume-distance-from-the-sun-gravitational-force-period-of-revolution-speed-of-revolution, standard-6-interconnectedness, patterns-of-change fig: esci12019-examw_g19.png

    If this pattern continues, during the first six hours on Wednesday, tidal height will

    (1) decrease, only

    (2) decrease, then increase

    (3) increase, only

    (4) increase, then decrease

    8

    The graph below shows the tidal changes in ocean water level, in meters, recorded at a coastal location on a certain day.

    seasons-and-astronomy, tides, standard-1-math-and-science-inquery, velocity-slope-sediment-size-channel-shape-stream-valume-distance-from-the-sun-gravitational-force-period-of-revolution-speed-of-revolution fig: esci62013-examw_g1.png

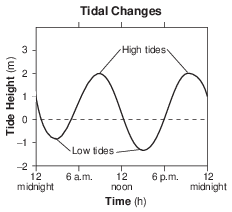
    Approximately how many hours apart were the two high tides?

    (1) 6 h

    (2) 12 h

    (3) 18 h

    (4) 24 h

    9

    Ocean tides observed at coastal locations each day are primarily caused by

    (1) Earth’s revolution around the Sun

    (2) the changing phases of the Moon

    (3) the gravitational attraction between the Moon and Earth

    (4) seasonal changes in the compass location of sunrise

    10

    The graph below shows ocean water levels for a shoreline location on Long Island, New York. The graph also indicates the dates and times of high and low tides.

    seasons-and-astronomy, tides, standard-1-math-and-science-inquery, velocity-slope-sediment-size-channel-shape-stream-valume-distance-from-the-sun-gravitational-force-period-of-revolution-speed-of-revolution fig: esci62016-examw_g18.png

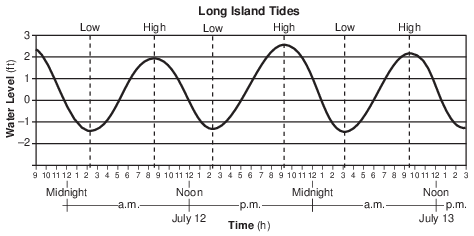
    Based on the data, the next high tide occurred at approximately

    (1) 4 p.m. on July 13

    (2) 10 p.m. on July 13

    (3) 4 p.m. on July 14

    (4) 10 p.m. on July 14

    Base your answers to questions 11 on the diagram in image provided, which represents eight positions of the Moon in its orbit around Earth.
    11

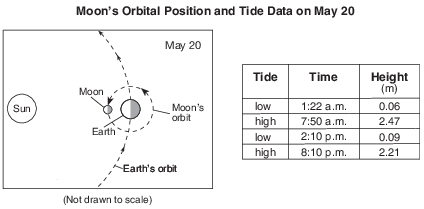
    Explain why the Moon’s gravity has a greater effect on Earth’s ocean tides than the Sun’s gravity. [1]

    Allow 1 credit. Acceptable responses include, but are not limited to:

    • — The Moon is closer to Earth so gravity is greater.

    • — The Sun is much farther away.

    Base your answers to questions 12 on the calendar and data table below. The calendar shows the month of February 2007, indicating the dates when some lunar phases occurred. February 24 lists only the name of the Moon phase that occurred on that day. The data table shows the highest and lowest tides (in feet) recorded for the Hudson River at Kingston, New York, over a 2-day period in February 2007.

    seasons-and-astronomy, tides, seasons-and-astronomy, motion-of-objects-in-the-solar-system, standard-1-math-and-science-inquery, eccentricity-rate-gradient-standard-error fig: esci62012-exam_w_g64.png

    seasons-and-astronomy, tides, seasons-and-astronomy, motion-of-objects-in-the-solar-system, standard-1-math-and-science-inquery, eccentricity-rate-gradient-standard-error fig: esci62012-exam_w_g65.png

    12

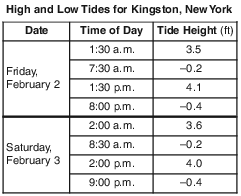
    On the grid in the image provided, plot the tide height for each time of day listed in the data table. Connect the plots with a line. [1]

    seasons-and-astronomy, tides, seasons-and-astronomy, motion-of-objects-in-the-solar-system, standard-1-math-and-science-inquery, eccentricity-rate-gradient-standard-error fig: esci62012-ansb_w_abkq7.png

    Allow 1 credit if the centers of all eight plots are located within the circles shown below and are connected with a line that passes within each circle.

    • Note: It is recommended that an overlay of the same scale as the student answer booklet be used

    • to ensure reliability in rating.

    seasons-and-astronomy, tides, seasons-and-astronomy, motion-of-objects-in-the-solar-system, standard-1-math-and-science-inquery, eccentricity-rate-gradient-standard-error fig: esci62012-rg_g7.png

    Base your answers to questions 13 on the graph below and on your knowledge of Earth science. The graph shows the changes in ocean tide height at a New York State location during 1 day.

    seasons-and-astronomy, tides, standard-1-math-and-science-inquery, eccentricity-rate-gradient-standard-error fig: esci62014-examw_g42.png

    13

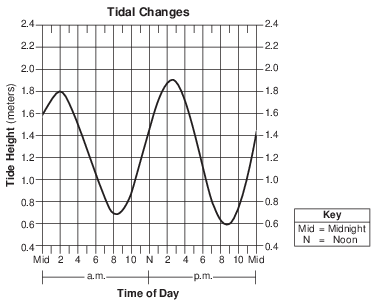
    Determine the tide height and time of day for the lowest tide shown on the graph. Include a.m. or p.m. in your answer for the time of day. [1]

    Tide height:

    Time:

    Allow 1 credit if both the tide height and time of day, including p.m., are correct.

    • Tide height: any value from 0.58 m to 0.6 m.

    • Time: any value from 8:30 p.m. to 9:00 p.m.

    Base your answers to questions 14 on the diagrams and tables below and on your knowledge of Earth science. Each diagram represents the Moon’s orbital position and each table lists times of high and low tides and tide heights, in meters, at New York City for the date shown.

    seasons-and-astronomy, tides, standard-6-interconnectedness, models, standard-6-interconnectedness, patterns-of-change fig: esci62015-exam_g46.png

    seasons-and-astronomy, tides, standard-6-interconnectedness, models, standard-6-interconnectedness, patterns-of-change fig: esci62015-exam_g45.png

    14

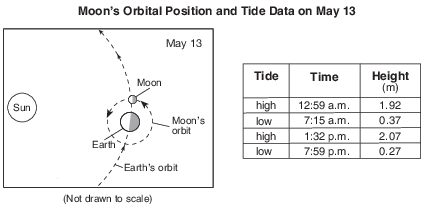
    Determine the length of time between the two high tides shown for May 13. [1]

    ____________ h ____________ min

    Allow 1 credit for 12 h 33 min.

    Base your answers to questions 15 on the diagram in image provided and on your knowledge of Earth science. The diagram represents the Sun’s apparent daily path for the first day of three seasons at 43° North latitude. The solid lines represent daytime paths as seen by an observer at this latitude. The dashed lines represent the nighttime paths that can not be seen by the observer.
    15

    On the diagram in the image provided, draw an X to represent the solar noon position of the Sun as seen by the observer on April 21. [1]

    seasons-and-astronomy, tides, standard-6-interconnectedness, models, standard-6-interconnectedness, patterns-of-change fig: esci62018-ansbk_abkq1.png

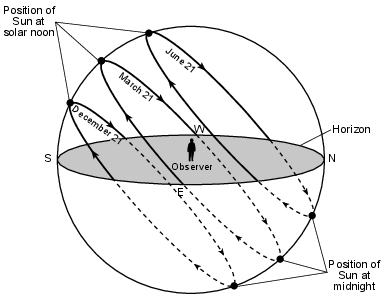
    Allow 1 credit if the center of the X is within or touches the boxed area shown below.

    • Note: It is recommended that an overlay of the same scale as the student answer booklet be used

    • to ensure reliability in rating.

    seasons-and-astronomy, tides, standard-6-interconnectedness, models, standard-6-interconnectedness, patterns-of-change fig: esci62018-rg_g1.png