
Topic: Topographic Maps
Topographic Maps
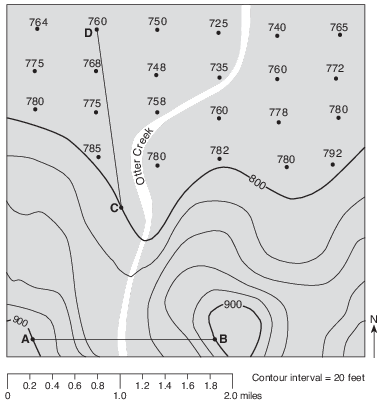
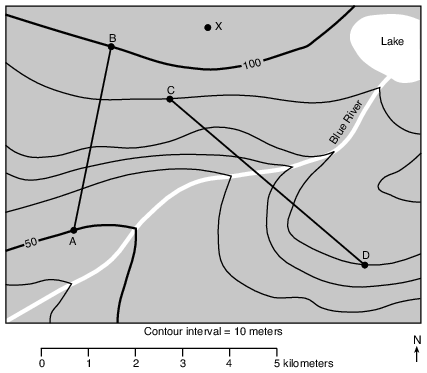
Four locations, A, B, C, and D, are represented on the topographic map below.
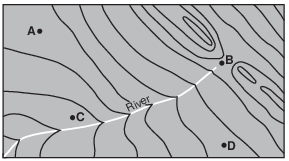
Which lettered location has the highest elevation?
(1) A
(2) B
(3) C
(4) D
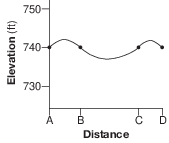
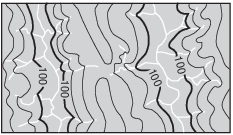
The topographic map below shows a depression contour line  on Earth’s surface. Points A, B, C, and D represent surface locations. Contour line elevations are in feet.

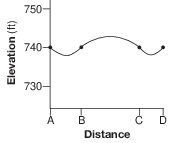
Which profile best shows the topography along line AD?
(1) 
(2) 
(3) 
(4) 
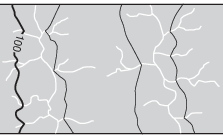
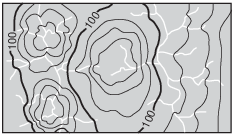
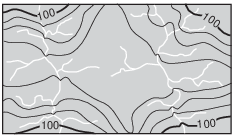
The map below shows part of a stream drainage pattern.
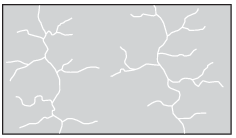
Which topographic map best shows the contour lines for this stream drainage pattern?
(1) 
(2) 
(3) 
(4) 
The topographic map below shows a portion of the Cayuta Creek that is located in New York State. Points A, B, C, and D represent locations on Earth’s surface.
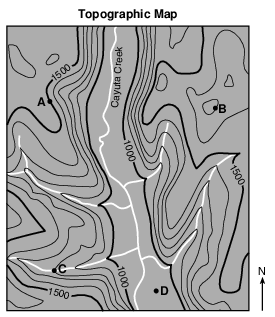
Which point on the map most likely represents a location within the flood plain associated with Cayuta Creek?
(1) A
(2) B
(3) C
(4) D
A topographic map and an incorrectly constructed profile from point A to point H on the map are shown below.
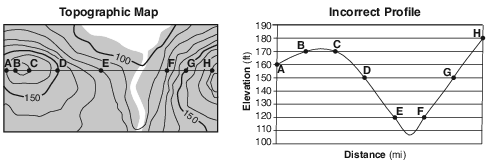
What mistake was made in the construction of this profile?
(1) using a contour interval of 10 feet
(2) plotting points A through H the same distance apart horizontally
(3) drawing a curved line instead of a straight line from point B to point C
(4) increasing the elevation from point F to point H
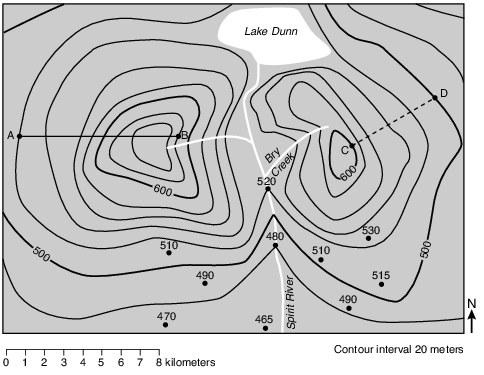
On the topographic map in the image provided, complete the 480-meter, 500-meter, and 520-meter contour lines on the southern portion of the map. [1]
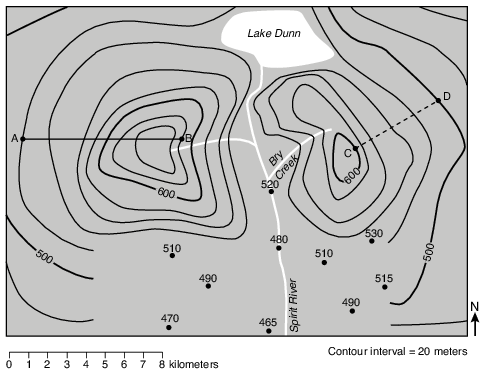
Allow 1 credit if all three contour lines are correctly drawn and connected to the partially drawn contour lines on either side of Spirit River.
• Note: If additional contour lines are drawn, all must be correct to receive credit.
• Do not allow credit if student-drawn contour lines do not pass through or touch the 480 m or 520 m dots.
• Example of a 1-credit response:
• 
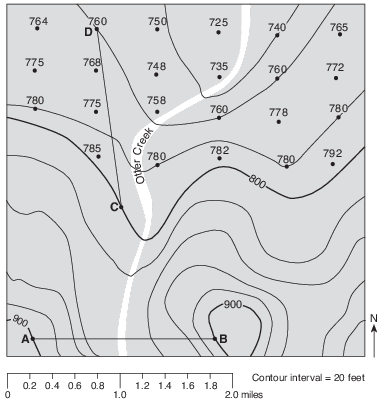
On the map in the image provided, draw contour lines for the 780-ft, 760-ft, and 740-ft elevations. Extend your contour lines to the edges of the map. [1]
Allow 1 credit if all three contour lines are correctly drawn. Contour lines must extend to the edges of the map to receive credit. If additional contour lines are drawn, all must be correct to receive credit.
• Example of a 1-credit response:
• 
On the map in the image below, complete the 600-ft, 700-ft, and 800-ft contour lines in section I. Extend the lines to the edge of the map. [1]
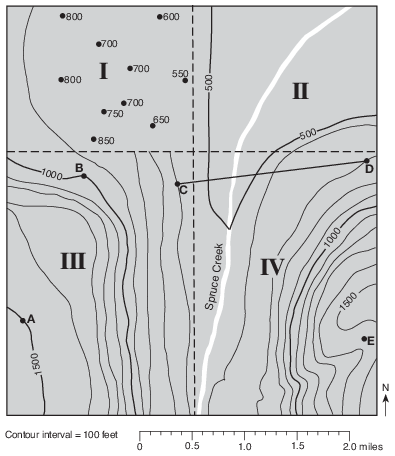
Allow 1 credit if all three contour lines are drawn correctly. If additional contour lines are drawn, all must be correct to receive credit.
• Note: All three contour lines must extend to the edge of the map to receive credit.
On the map in the image provided, draw the 50-ft and 55-ft contour lines. The contour lines must extend to the edges of the map. [1]
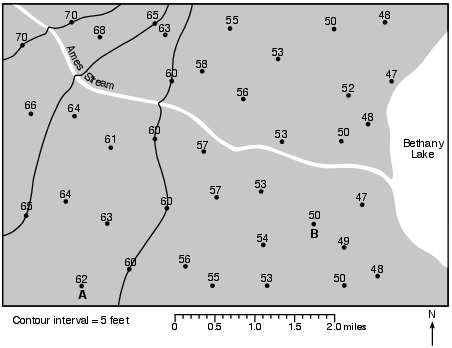
Allow 1 credit for correctly drawing both the 50-ft and 55-ft contour lines to the edges of the map.
• Note: Allow credit even if the student’s lines do not make a V-shape when the stream is crossed.
• If additional contour lines are drawn, all must be correctly drawn to receive credit.
• Example of a 1-credit response:
• 
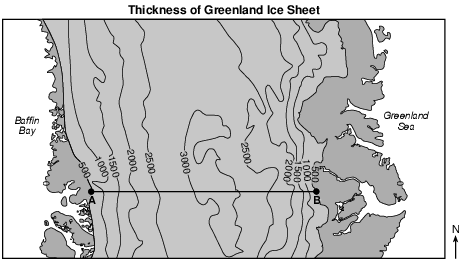
Greenland Ice Sheet
The Greenland Ice Sheet is a vast body of ice covering roughly 80 percent of the surface of Greenland. The ice sheet is almost 2400 kilometers long in a north-south direction. The ice sheet, consisting of layers of snow compressed over more than 100,000 years, contains a valuable record about Earth’s past climates. The ice sheet glaciers continue to flow seaward and deposit sediment, but global warming has affected them. Warmer air temperatures have caused increased melting, resulting in a thinning of the ice sheet and faster glacial movement at the ice sheet edges.
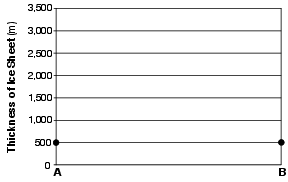
On the grid in the image provided, construct a profile along line AB by plotting the thickness of the ice sheet where each isoline crosses line AB. Thicknesses of the ice sheet at A and B have been plotted on the grid. Connect all twelve plots with a line from A to B to complete the profile. [1]
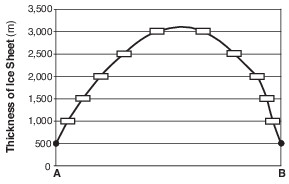
Allow 1 credit if the centers of all ten student plots are located within or touch the rectangles shown below and all twelve plots are correctly connected with a line that passes within or touches the rectangles from point A to point B. The high point of the line must extend above 3000 m, but below 3500 m.
• Note: Allow credit if the student-drawn line does not pass through the student plots, but is still
• within or touches the rectangles.
• It is recommended that an overlay of the same scale as the student answer booklet be used to ensure reliability in rating.
• Example of a 1-credit response:
• 
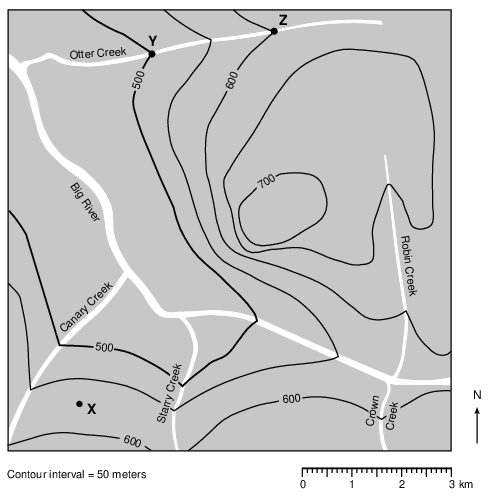
State one possible elevation of point X. [1]
______________ m
Allow 1 credit for any value greater than 550 m, but less than 600 m.
Calculate the gradient along the reference line from A to B. Include units with your answer. [1]
Allow 1 credit for any value from 12.1 to 12.9 and the correct units. Units include, but are not limited to:
• — m/km
• — meters per kilometer
On the map in the image provided, draw the −1000-meter ocean-depth isoline. Extend the isoline to the edge of the map. [1]
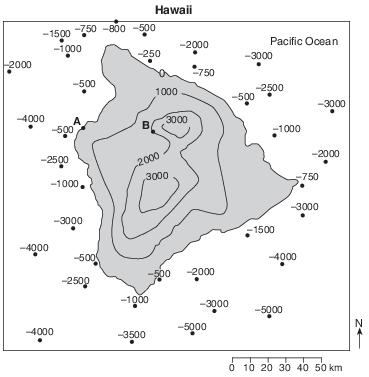
Allow 1 credit if the −1000 isoline is correctly drawn to the edge of the map. If additional isolines are drawn, all isolines must be correct to receive credit.
• 
On the map in the image provided, draw the 60-meter and 70-meter contour lines. The contour lines should extend to the edges of the map. [1]

Allow 1 credit for correctly drawing both the 60-m and 70-m contour lines extended to the edges of the map.
• Note: If additional contour lines are drawn, all must be drawn correctly to receive credit.
• Example of a 1-credit response:
• 
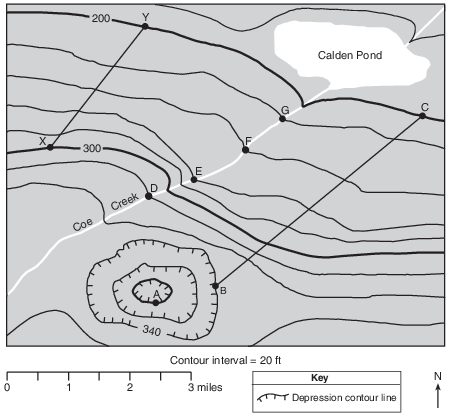
What is the elevation of location A? [1]
ft
Allow 1 credit for 300 ft.