Earth Science worksheet
    Topic: Use Isolines To Determine A Source Of Pollution
    Use Isolines To Determine A Source Of Pollution
    1

    The weather map below shows a storm centered north of Iceland. Points A, B, C, and D indicate locations on Earth’s surface. Isobars are labeled in millibars.

    meteorology, weather-basics-and-observable-patterns, standard-1-math-and-science-inquery, use-isolines-to-determine-a-source-of-pollution, standard-6-interconnectedness, models fig: esci-v202-exam_g9.png

    Which location was probably experiencing the highest wind speed?

    (1) A

    (2) B

    (3) C

    (4) D

    2

    The diagram below represents a model of the planet Saturn drawn to a scale of 1 centimeter = 40,000 kilometers.

    reference-tables, solar-system-data, seasons-and-astronomy, the-solar-system, standard-1-math-and-science-inquery, use-isolines-to-determine-a-source-of-pollution, standard-1-math-and-science-inquery, changing-length-of-a-shadow-based-on-the-motion-of-the-sun, standard-6-interconnectedness, magnitude-and-scale fig: esci12019-examw_g15.png

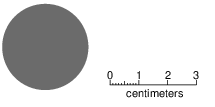
    Which diagram best represents Earth drawn to this same scale?
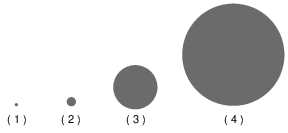
    reference-tables, solar-system-data, seasons-and-astronomy, the-solar-system, standard-1-math-and-science-inquery, use-isolines-to-determine-a-source-of-pollution, standard-1-math-and-science-inquery, changing-length-of-a-shadow-based-on-the-motion-of-the-sun, standard-6-interconnectedness, magnitude-and-scale fig: esci12019-examw_g16.png

    (1) 1

    (2) 2

    (3) 3

    (4) 4

    Base your answers to questions 3 on the topographic map below. Points A, X, and Y are reference points on the map.

    maps-and-measurement, topographic-maps, standard-1-math-and-science-inquery, use-isolines-to-determine-a-source-of-pollution, standard-6-interconnectedness, models fig: esci62012-exam_w_g55.png

    3

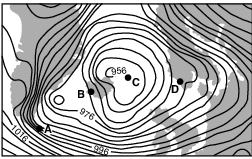
    What is a possible elevation of point A?

    (1) 575 meters

    (2) 600 meters

    (3) 655 meters

    (4) 710 meters

    4

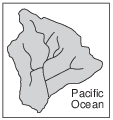
    The topographic map below shows the largest island of the Hawaiian Islands.

    landscapes, erosion-and-natural-agents-of-erosion, standard-1-math-and-science-inquery, use-isolines-to-determine-a-source-of-pollution, standard-6-interconnectedness, models fig: esci62014-examw_g22.png

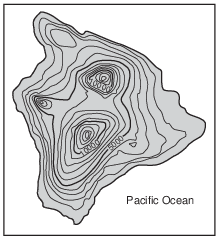
    Which map below best shows the most likely stream drainage pattern of this island?

    (1) landscapes, erosion-and-natural-agents-of-erosion, standard-1-math-and-science-inquery, use-isolines-to-determine-a-source-of-pollution, standard-6-interconnectedness, models fig: esci62014-examw_g23.png

    (2) landscapes, erosion-and-natural-agents-of-erosion, standard-1-math-and-science-inquery, use-isolines-to-determine-a-source-of-pollution, standard-6-interconnectedness, models fig: esci62014-examw_g24.png

    (3) landscapes, erosion-and-natural-agents-of-erosion, standard-1-math-and-science-inquery, use-isolines-to-determine-a-source-of-pollution, standard-6-interconnectedness, models fig: esci62014-examw_g25.png

    (4) landscapes, erosion-and-natural-agents-of-erosion, standard-1-math-and-science-inquery, use-isolines-to-determine-a-source-of-pollution, standard-6-interconnectedness, models fig: esci62014-examw_g26.png

    Base your answers to questions 5 on the topographic map in image provided and on your knowledge of Earth science. Partially drawn contour lines are shown on the southern portion of the map. Points of elevation are recorded in meters. Points A, B, C, and D represent locations on Earth’s surface. Line AB and dashed line CD are reference lines.
    5

    On the topographic map in the image provided, complete the 480-meter, 500-meter, and 520-meter contour lines on the southern portion of the map. [1]

    maps-and-measurement, topographic-maps, standard-1-math-and-science-inquery, use-isolines-to-determine-a-source-of-pollution, standard-6-interconnectedness, models fig: esci-v202-ansbk_abkq4.png

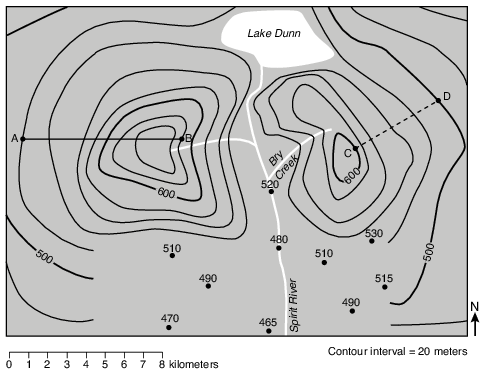
    Allow 1 credit if all three contour lines are correctly drawn and connected to the partially drawn contour lines on either side of Spirit River.

    • Note: If additional contour lines are drawn, all must be correct to receive credit.

    • Do not allow credit if student-drawn contour lines do not pass through or touch the 480 m or 520 m dots.

    • Example of a 1-credit response:

    maps-and-measurement, topographic-maps, standard-1-math-and-science-inquery, use-isolines-to-determine-a-source-of-pollution, standard-6-interconnectedness, models fig: esci-v202-rg_g4.png

    Base your answers to questions 6 on the data table below, which shows the air temperature, in degrees Fahrenheit, and air pressure, in inches of mercury (Hg), recorded at a weather station in New York State from 11 a.m. to 7 p.m. on a day in September.

    meteorology, presentation-of-weather-data, standard-1-math-and-science-inquery, velocity-slope-sediment-size-channel-shape-stream-valume-distance-from-the-sun-gravitational-force-period-of-revolution-speed-of-revolution, standard-1-math-and-science-inquery, use-isolines-to-determine-a-source-of-pollution fig: esci12012-examw_g36.png

    6

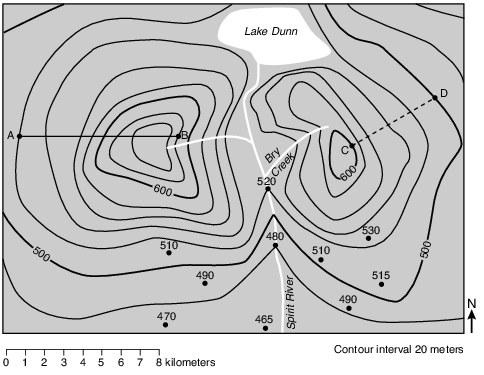
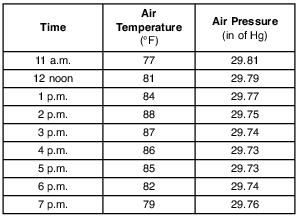
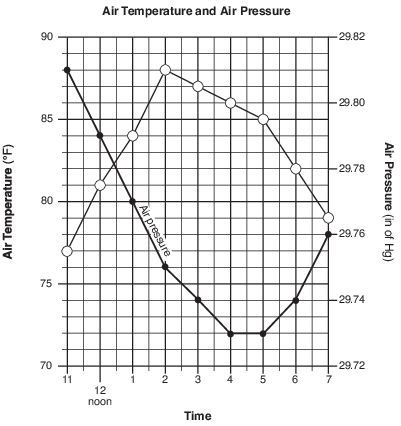
    On the grid in the image provided, construct a line graph by plotting the data for the air temperature for each time from 11 a.m. to 7 p.m. Connect the plots with a line. The data for air pressure have been plotted. [1]

    meteorology, presentation-of-weather-data, standard-1-math-and-science-inquery, velocity-slope-sediment-size-channel-shape-stream-valume-distance-from-the-sun-gravitational-force-period-of-revolution-speed-of-revolution, standard-1-math-and-science-inquery, use-isolines-to-determine-a-source-of-pollution fig: esci-ansbklt112w_abkq2.png

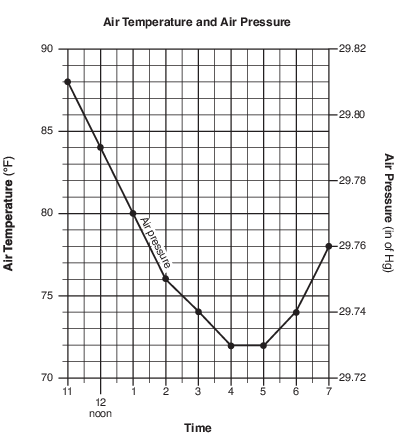
    Allow 1 credit if the centers of all nine plots are within the circles shown and are correctly connected with a line that passes within each circle.

    • Note: It is recommended that an overlay of the same scale as the student answer booklet be used

    • to ensure reliability in rating.

    meteorology, presentation-of-weather-data, standard-1-math-and-science-inquery, velocity-slope-sediment-size-channel-shape-stream-valume-distance-from-the-sun-gravitational-force-period-of-revolution-speed-of-revolution, standard-1-math-and-science-inquery, use-isolines-to-determine-a-source-of-pollution fig: esci12012-rg_g2.png

    Base your answers to questions 7 on the diagram and tables below. The diagram shows a rock sample containing fossils from a location in New York State at 42° N 78° 15⬘ W. Fossils 1, 2, 3, and 4 are labeled. Table A lists the names and rock types of the New York State rock units from the Middle and Late Devonian in this area. The presence of fossil 1, 2, 3, or 4 in a rock unit is indicated by an X in the fossils column in the table. Table B identifies typical rocks formed within different marine (ocean) environments.

    reference-tables, generalized-bedrock-geology-of-new-york-state, landscapes, patterns-of-deposition-and-formation-of-sedimentary-rocks, standard-6-interconnectedness, models fig: esci12013-exam_g37.png

    reference-tables, generalized-bedrock-geology-of-new-york-state, landscapes, patterns-of-deposition-and-formation-of-sedimentary-rocks, standard-6-interconnectedness, models fig: esci12013-exam_g39.png

    reference-tables, generalized-bedrock-geology-of-new-york-state, landscapes, patterns-of-deposition-and-formation-of-sedimentary-rocks, standard-6-interconnectedness, models fig: esci12013-exam_g38.png

    7

    According to the tables, in which marine environment was the Tully rock unit deposited? [1]

    Allow 1 credit for clear, shallow water.

    Base your answers to questions 8 on the map and passage below.

    A Lake-Effect Snowstorm

    A snowstorm affected western New York State on October 12 and 13, 2006. A blend of weather conditions caused more than 24 inches of heavy, wet, lake-effect snow, bringing much of western New York to a standstill. The New York State Thruway was closed to traffic between exits 46 and 59, which are circled on the map. The isolines on the map show the amount of snowfall, measured in inches, resulting from this storm. Points A and B represent locations on Earth’s surface.

    meteorology, presentation-of-weather-data, meteorology, weather-variables, standard-6-interconnectedness, models fig: esci12013-exam_g43.png

    8

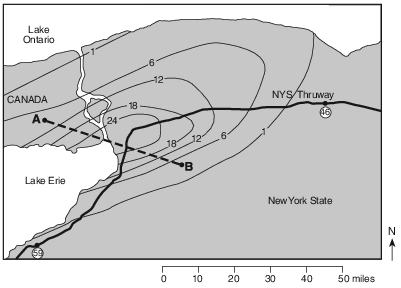
    Determine the number of inches of snow that was received in Niagara Falls, New York, from this snowstorm. [1]

    in

    Allow 1 credit for any value greater than 1 in, but less than 6 in.

    Base your answers to questions 9 on the diagram in image provided, which represents eight positions of the Moon in its orbit around Earth.
    9

    On the diagram in the image provided, circle the position of the Moon where a solar eclipse is possible. [1]

    seasons-and-astronomy, motion-of-objects-in-the-solar-system, standard-1-math-and-science-inquery, use-isolines-to-determine-a-source-of-pollution, standard-1-math-and-science-inquery, geocentric-model-heliocentric-model, standard-6-interconnectedness, models fig: esci12013-ansbk_abkq7.png

    Allow 1 credit for circling only position 6.

    Base your answers to questions 10 on the geologic timeline below and on your knowledge of Earth science. The geologic timeline, drawn to scale, represents Earth’s geologic history. The letters A through H on the timeline represent the times of occurrence for specific, labeled geologic events. The time of occurrence for letter A has been omitted.

    geologic-history, reference-tables, earth-history, evolution-of-life-forms-and-the-free-oxygen-in-the-atmosphere, standard-1-math-and-science-inquery, changing-length-of-a-shadow-based-on-the-motion-of-the-sun, standard-6-interconnectedness, models fig: esci12017-examw_g32.png

    10

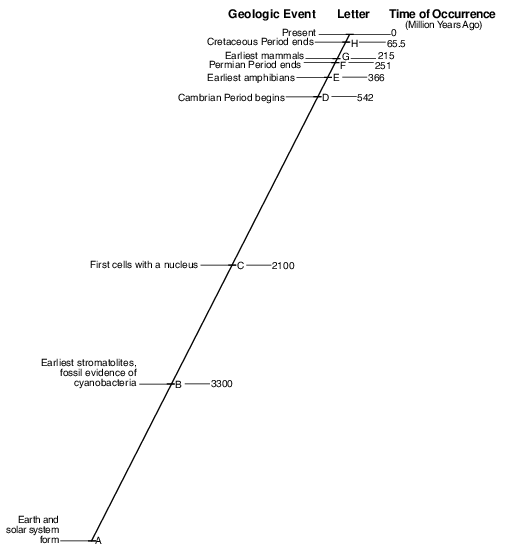
    Describe the major change in Earth’s atmosphere that was occurring at the time when the first cells with a nucleus appeared on Earth. [1]

    Allow 1 credit. Acceptable responses include, but are not limited to:

    • — Oceanic oxygen began to enter the atmosphere.

    • — Excess oxygen in the oceans escaped into the atmosphere.

    • — A buildup of oxygen began.

    • — Photosynthetic bacteria released oxygen.

    Base your answers to questions 11 on the map below and on your knowledge of Earth science. The map shows areas of daylight and darkness in New York State on March 21. Six locations are labeled on the map.

    seasons-and-astronomy, earth-rotation, standard-1-math-and-science-inquery, geocentric-model-heliocentric-model fig: esci12018-examw_g50.png

    11

    State the altitude of Polaris as seen by an observer on Slide Mountain. [1]

    °

    Allow 1 credit for 42°.

    • Note: Do not allow credit if a compass direction is given (e.g., 42 N or 42° N) because that

    • indicates latitude, not altitude.

    Base your answers to questions 12 on the information and data table below and on your knowledge of Earth science. The table shows data for the six planets in the Kepler-11 star system.

    Kepler-11 is one of many star systems discovered by space satellites. Scientists find this system unusual because of its small size and its six planets, identified by letters b through g, that orbit relatively close to its central star. The central star, Kepler-11, has a surface temperature of 5663 K and a luminosity of 1.0.

    seasons-and-astronomy, the-solar-system, standard-1-math-and-science-inquery, velocity-slope-sediment-size-channel-shape-stream-valume-distance-from-the-sun-gravitational-force-period-of-revolution-speed-of-revolution fig: esci12020-examw_g43.png

    12

    The diagram in the image provided represents the scaled distances of Mercury, Venus, and Earth from the Sun. Place an X on the line to indicate where Kepler-11c would be located if it were in our solar system. [1]

    seasons-and-astronomy, motion-of-objects-in-the-solar-system, standard-1-math-and-science-inquery, use-isolines-to-determine-a-source-of-pollution, standard-6-interconnectedness, magnitude-and-scale fig: esci12020-ansbkw_abkq8.png

    Allow 1 credit if the center of the X is within or touches the edge of the box below.. Note: Allow credit if a symbol other than an X is used.

    • It is recommended that an overlay of the same scale as the student answer booklet be used to ensure reliability in rating.

    seasons-and-astronomy, motion-of-objects-in-the-solar-system, standard-1-math-and-science-inquery, use-isolines-to-determine-a-source-of-pollution, standard-6-interconnectedness, magnitude-and-scale fig: esci12020-rg_g8.png

    • (Distances drawn to scale in million kilometers)

    Base your answers to questions 13 on the topographic map in the image provided and on your knowledge of Earth science. Some contour lines have been drawn. Line AB is a reference line on the map.
    13

    On the map in the image provided, draw the 60-meter and 70-meter contour lines. The contour lines should extend to the edges of the map. [1]

    maps-and-measurement, topographic-maps, standard-1-math-and-science-inquery, use-isolines-to-determine-a-source-of-pollution, standard-6-interconnectedness, models, standard-6-interconnectedness, magnitude-and-scale fig: esci62014-ansbk_abkq1.png

    Allow 1 credit for correctly drawing both the 60-m and 70-m contour lines extended to the edges of the map.

    • Note: If additional contour lines are drawn, all must be drawn correctly to receive credit.

    • Example of a 1-credit response:

    maps-and-measurement, topographic-maps, standard-1-math-and-science-inquery, use-isolines-to-determine-a-source-of-pollution, standard-6-interconnectedness, models, standard-6-interconnectedness, magnitude-and-scale fig: esci62014-rgp_g1.png

    Base your answers to questions 14 on the diagram below and on your knowledge of Earth science. The diagram represents a time-exposure photograph taken by aiming a camera at Polaris in the night sky and leaving the shutter open for a period of time to record star trails. The angular arcs (star trails) show the apparent motions of some stars.

    seasons-and-astronomy, earth-rotation, standard-6-interconnectedness, systems-thinking, standard-6-interconnectedness, models, standard-6-interconnectedness, patterns-of-change fig: esci62015-exam_g37.png

    14

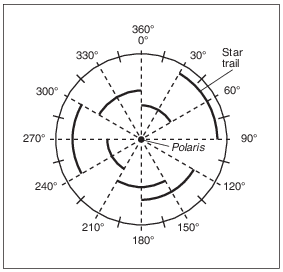
    Determine the number of hours it took to record the star trails labeled on the diagram. [1]

    h

    Allow 1 credit for a response that indicates 4 h.

    Base your answers to questions 15 on the topographic map below and on your knowledge of Earth science. Point A represents a location on Earth’s surface. Lines BC and XY are reference lines on the map. Points D, E, F, and G represent locations along Coe Creek. Elevations are shown in feet.

    maps-and-measurement, topographic-maps, standard-1-math-and-science-inquery, use-isolines-to-determine-a-source-of-pollution, standard-6-interconnectedness, models, standard-6-interconnectedness, magnitude-and-scale fig: esci62015-exam_g41.png

    15

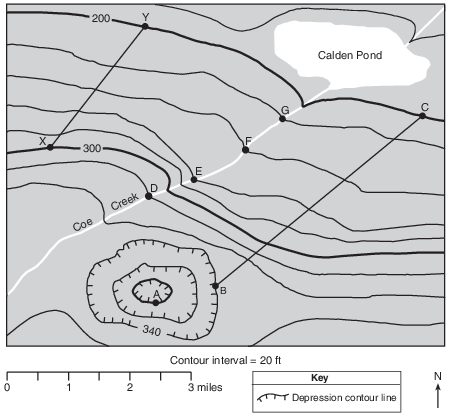
    What is the elevation of location A? [1]

    ft

    Allow 1 credit for 300 ft.