Earth Science worksheet
    Topic: Variations Of Insolation
    Variations Of Insolation
    Base your answers to questions 1 on the diagram below and on your knowledge of Earth science. The diagram represents Earth’s orbit around the Sun. Positions A, B, C, and D represent Earth’s location on the fi rst day of each season. Letter N indicates the North Pole.

    seasons-and-astronomy, earth-revolution, seasons-and-astronomy, the-solar-system, standard-1-math-and-science-inquery, geocentric-model-heliocentric-model fig: esci12019-examw_g25.png

    1

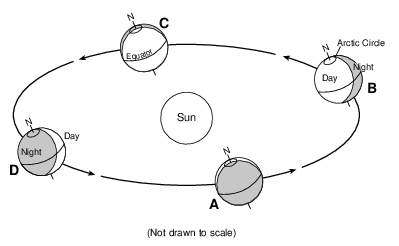
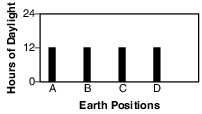
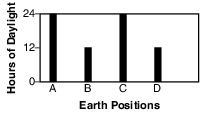
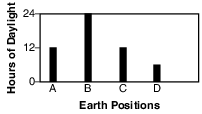
    Which graph best shows the hours of daylight that occur at the equator on all four Earth positions shown?

    (1) insolation-and-the-seasons, variations-of-insolation, standard-1-math-and-science-inquery, velocity-slope-sediment-size-channel-shape-stream-valume-distance-from-the-sun-gravitational-force-period-of-revolution-speed-of-revolution, standard-1-math-and-science-inquery, geocentric-model-heliocentric-model fig: esci12019-examw_g26.png

    (2) insolation-and-the-seasons, variations-of-insolation, standard-1-math-and-science-inquery, velocity-slope-sediment-size-channel-shape-stream-valume-distance-from-the-sun-gravitational-force-period-of-revolution-speed-of-revolution, standard-1-math-and-science-inquery, geocentric-model-heliocentric-model fig: esci12019-examw_g27.png

    (3) insolation-and-the-seasons, variations-of-insolation, standard-1-math-and-science-inquery, velocity-slope-sediment-size-channel-shape-stream-valume-distance-from-the-sun-gravitational-force-period-of-revolution-speed-of-revolution, standard-1-math-and-science-inquery, geocentric-model-heliocentric-model fig: esci12019-examw_g28.png

    (4) insolation-and-the-seasons, variations-of-insolation, standard-1-math-and-science-inquery, velocity-slope-sediment-size-channel-shape-stream-valume-distance-from-the-sun-gravitational-force-period-of-revolution-speed-of-revolution, standard-1-math-and-science-inquery, geocentric-model-heliocentric-model fig: esci12019-examw_g29.png

    Base your answers to questions 2 on the passage below and on your knowledge of Earth science.

    Cosmic Microwave Background Radiation

    In the 1920s, Edwin Hubble’s discovery of a pattern in the red shift of light from galaxies moving away from Earth led to the theory of an expanding universe. This expansion implies that the universe was smaller, denser, and hotter in the past. In the 1940s, scientists predicted that heat (identified as cosmic microwave background radiation) left over from the Big Bang would fill the universe. In the 1960s, satellite probes found that cosmic microwave background radiation fills the universe uniformly in every direction, and indicated a temperature of about 3 kelvins (K). This radiation has been cooling as the universe has been expanding.

    2

    The diagram below represents the spectral lines from the light of an element in a laboratory on Earth.

    insolation-and-the-seasons, variations-of-insolation, standard-1-math-and-science-inquery, geocentric-model-heliocentric-model, standard-6-interconnectedness, models, standard-6-interconnectedness, patterns-of-change fig: esci62013-examw_g39.png

    Which diagram below best represents the pattern of spectral lines from the same element when it was observed by Edwin Hubble in the light of one of the distant galaxies?

    (1) insolation-and-the-seasons, variations-of-insolation, standard-1-math-and-science-inquery, geocentric-model-heliocentric-model, standard-6-interconnectedness, models, standard-6-interconnectedness, patterns-of-change fig: esci62013-examw_g35.png

    (2) insolation-and-the-seasons, variations-of-insolation, standard-1-math-and-science-inquery, geocentric-model-heliocentric-model, standard-6-interconnectedness, models, standard-6-interconnectedness, patterns-of-change fig: esci62013-examw_g36.png

    (3) insolation-and-the-seasons, variations-of-insolation, standard-1-math-and-science-inquery, geocentric-model-heliocentric-model, standard-6-interconnectedness, models, standard-6-interconnectedness, patterns-of-change fig: esci62013-examw_g37.png

    (4) insolation-and-the-seasons, variations-of-insolation, standard-1-math-and-science-inquery, geocentric-model-heliocentric-model, standard-6-interconnectedness, models, standard-6-interconnectedness, patterns-of-change fig: esci62013-examw_g38.png

    Base your answers to questions 3 on the diagram below and on your knowledge of Earth science. The diagram represents Earth’s position in its orbit on the first day of each of the four seasons, one of which is labeled A. The North Pole is labeled N. Earth’s closest distance to the Sun and Earth’s farthest distance from the Sun are labeled in kilometers.

    insolation-and-the-seasons, variations-of-insolation, standard-6-interconnectedness, models, standard-6-interconnectedness, patterns-of-change fig: esci62017-exampwr_g20.png

    3

    How many hours (h) of daylight are received at the Arctic Circle when Earth is at position A?

    (1) 0 h

    (2) 12 h

    (3) 18 h

    (4) 24 h

    Base your answers to questions 4 on the diagrams below and on your knowledge of Earth science. The diagrams, labeled A, B, and C, represent equal-sized portions of the Sun’s rays striking Earth’s surface at 23.5° N latitude at noon at three different times of the year. The angle at which the Sun’s rays hit Earth’s surface and the relative areas of Earth’s surface receiving the rays at the three different angles of insolation are shown.

    insolation-and-the-seasons, variations-of-insolation, standard-1-math-and-science-inquery, geocentric-model-heliocentric-model, standard-6-interconnectedness, models fig: esci82015-exam_g40.png

    4

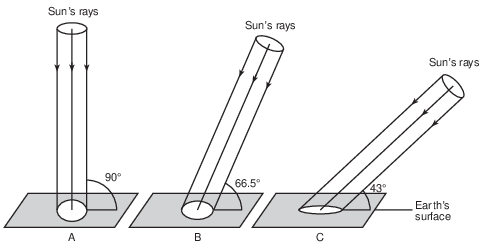
    As the angle of the Sun’s rays striking Earth’s surface at noon changes from 90° to 43°, the length of a shadow cast by an object will

    (1) decrease

    (2) increase

    (3) decrease, then increase

    (4) increase, then decrease

    5

    An observer in New York City measured the angle of insolation at solar noon each day. During which month did this observer see the noontime angle of insolation increase each day?

    (1) April

    (2) July

    (3) September

    (4) December

    6

    When equal masses of ice and liquid water receive the same amount of energy, without a change in state, the ice changes temperature faster than the liquid water does because the

    (1) specific heat of ice is less than the specific heat of liquid water

    (2) specific heat of ice is greater than the specific heat of liquid water

    (3) density of ice is less than the density of liquid water

    (4) density of ice is greater than the density of liquid water

    Base your answers to questions 7 on the diagram below and on your knowledge of Earth science. The diagram represents a simplified model of the incoming (solar) and outgoing (terrestrial) electromagnetic radiation of Earth’s energy budget.

    insolation-and-the-seasons, variations-of-insolation, standard-1-math-and-science-inquery, geocentric-model-heliocentric-model fig: esci-v202-exam_g31.png

    7

    Which color and texture of Earth materials absorbs the greatest amount of short-wave radiation from the Sun?

    (1) light color and smooth texture

    (2) light color and rough texture

    (3) dark color and smooth texture

    (4) dark color and rough texture

    8

    What best explains why, in early spring, ice remains longer on Lake Erie than on the surrounding land areas when the air temperature is above freezing?

    (1) Water has a higher specific heat than land.

    (2) Energy is needed for water to evaporate.

    (3) Cool winds from the surrounding land cool the ice on the lake.

    (4) Air temperature does not affect water temperature.

    9

    An increase in the transparency of Earth’s atmosphere is often caused by

    (1) a decrease in cloud cover

    (2) a decrease in solar radiation

    (3) an increase in airborne dust particles

    (4) an increase in the duration of insolation

    10

    Most of the electromagnetic energy radiated from Earth’s surface is in the form of

    (1) ultraviolet rays

    (2) infrared rays

    (3) gamma rays

    (4) x rays

    Base your answers to questions 11 on the data table below and on your knowledge of Earth science. The data table lists four constellations in which star clusters are seen from Earth. A star cluster is a group of stars near each other in space. Stars in the same cluster move at the same velocity. The length of the arrows in the table represents the amount of redshift of two wavelengths of visible light emitted by these star clusters.

    seasons-and-astronomy, big-bang, standard-6-interconnectedness, models fig: esci62016-examw_g43.png

    11

    Write the chemical symbol for the element, shown in the table, that absorbs the two wavelengths of light. [1]

    Allow 1 credit for Ca.

    Base your answers to questions 12 on the graph below and on your knowledge of Earth science. The graph shows changes in hours of daylight during the year at the latitudes of 0°, 30° N, 50° N and 60° N.

    insolation-and-the-seasons, variations-of-insolation, standard-1-math-and-science-inquery, velocity-slope-sediment-size-channel-shape-stream-valume-distance-from-the-sun-gravitational-force-period-of-revolution-speed-of-revolution fig: esci62016-examw_g47.png

    12

    The graph in the image provided shows a curve for the changing length of daylight over the course of one year that occurs for an observer at 50° N latitude. On this same graph in the image below, draw a line to show the changing length of daylight over the course of one year that occurs for an observer at 50° S latitude. [1]

    insolation-and-the-seasons, variations-of-insolation, standard-6-interconnectedness, patterns-of-change fig: esci62016-ansbk_abkq4.png

    Allow 1 credit for any line that extends from the beginning of January to the end of December, and is completely within the clear band shown below.

    • Note: It is recommended that an overlay of the same scale as the student answer sheet be used to

    • ensure reliability in rating.

    insolation-and-the-seasons, variations-of-insolation, standard-6-interconnectedness, patterns-of-change fig: esci62016-rg_g4.png

    Base your answers to questions 13 on the diagram below and on your knowledge of Earth science. The diagram represents the apparent path of the Sun across the sky as seen by an observer on Earth’s surface on June 21. Points A, B, C, and D represent positions of the Sun at different times of the day. The angle of Polaris above the horizon as seen in the nighttime sky is indicated.

    insolation-and-the-seasons, the-sun-apparent-path, seasons-and-astronomy, earth-rotation, standard-1-math-and-science-inquery, geocentric-model-heliocentric-model, standard-6-interconnectedness, models, standard-6-interconnectedness, patterns-of-change fig: esci62019-examw_g40.png

    13

    State the number of daylight hours at this location on September 23. [1]

    h

    Allow 1 credit for 12 h.

    Base your answers to questions 14 on the data table below and on the graph in image provided and on your knowledge of Earth science. The data table lists the number of daylight hours for a location at 50° N on the 21st day of each month for 1 year. The graph shows the number of daylight hours on the 21st day of each month for a location at 70° N and for the equator, 0°.

    insolation-and-the-seasons, variations-of-insolation, standard-1-math-and-science-inquery, velocity-slope-sediment-size-channel-shape-stream-valume-distance-from-the-sun-gravitational-force-period-of-revolution-speed-of-revolution fig: esci82014-examw_g44.png

    14

    Explain why the number of daylight hours for all three latitudes was 12 hours on March 21 and September 21. [1]

    Allow 1 credit. Acceptable responses include, but are not limited to:

    • — These dates represent the first days of spring and fall.

    • — The Sun rises due east and sets due west at all latitudes.

    • — The Sun’s direct rays are at the equator at solar noon on these dates.

    • — March 21 and September 21 are equinoxes.

    • — There are 12 hours of daylight and 12 hours of darkness on an equinox at all latitudes.

    • — Earth’s axis is not titled toward the Sun or away from the Sun at that time.

    Base your answers to questions 15 on the diagram below and on your knowledge of Earth science. In the diagram, letters A, B, C, and D represent Earth’s location on the first day of the four seasons as it orbits the Sun. Aphelion (Earth’s farthest distance from the Sun) and perihelion (Earth’s closest distance to the Sun) are labeled to show the approximate positions where they occur in Earth’s orbit. The dashed lines represent Earth’s axis, and the North Pole is labeled N.

    seasons-and-astronomy, earth-revolution, standard-6-interconnectedness, models fig: esci82018-examw_g46.png

    15

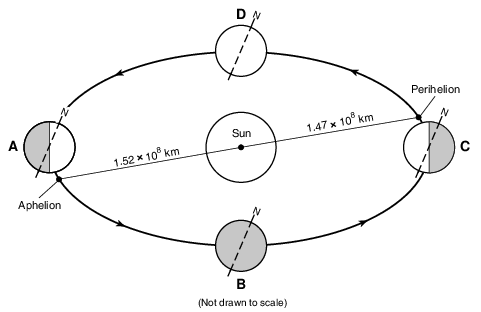
    State the number of hours of daylight that an observer in New York State will experience when Earth is at position D. [1]

    ______________ h

    Allow 1 credit for 12 h.