
Topic: Weather Basics And Observable Patterns
Weather Basics And Observable Patterns
Which atmospheric conditions occur when the dry-bulb temperature is 30°C and the difference between the dry-bulb temperature and wet-bulb temperature is 1°C?
(1) warm and humid
(2) warm and dry
(3) cool and humid
(4) cool and dry
Which precaution is most appropriate during a blizzard?
(1) Take shelter in a basement.
(2) Avoid unnecessary travel.
(3) Evacuate to higher ground.
(4) Stay away from tall metal objects.
The graph below shows the relationship between the distance that wind blows over a body of water and the height of the waves that are generated.
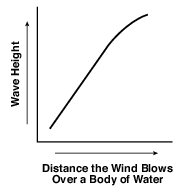
A west wind blowing with the same velocity would generate the highest waves along the shoreline at
(1) Jamestown
(2) Oswego
(3) Plattsburgh
(4) Riverhead
The weather map below shows a storm centered north of Iceland. Points A, B, C, and D indicate locations on Earth’s surface. Isobars are labeled in millibars.
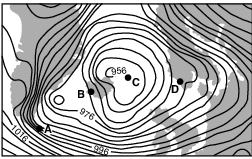
Which location was probably experiencing the highest wind speed?
(1) A
(2) B
(3) C
(4) D
Which map below shows the most likely storm track for a hurricane (![]() ) in the Atlantic Ocean?
) in the Atlantic Ocean?

(1) 1
(2) 2
(3) 3
(4) 4
Most tornadoes in the Northern Hemisphere are best described as violently rotating columns of air surrounded by
(1) clockwise surface winds moving toward the columns
(2) clockwise surface winds moving away from the columns
(3) counterclockwise surface winds moving toward the columns
(4) counterclockwise surface winds moving away from the columns
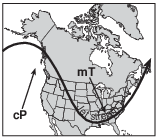
The map below shows a position of the polar jet stream over North America in January.
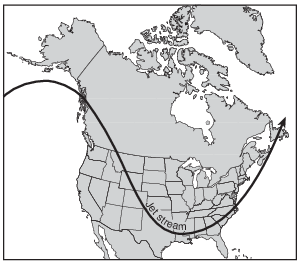
Which map best shows the air-mass movements associated with this jet stream position?
(1) 
(2) 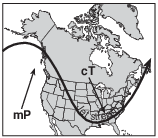
(3) 
(4) 
The diagram below shows the locations of the two major jet streams in Earth’s atmosphere.

Compared to the subtropical jet stream, the polar front jet stream is at a
(1) lower latitude and lower altitude
(2) lower latitude and higher altitude
(3) higher latitude and lower altitude
(4) higher latitude and higher altitude
The map below shows a typical position and average velocity of the polar front jet stream during two different seasons.
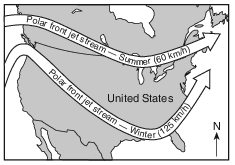
For the eastern United States, the change of the polar front jet stream from this summer position to this winter position causes
(1) warmer temperatures farther north and causes storms to move more slowly
(2) warmer temperatures farther north and causes storms to move more rapidly
(3) cooler temperatures farther south and causes storms to move more slowly
(4) cooler temperatures farther south and causes storms to move more rapidly
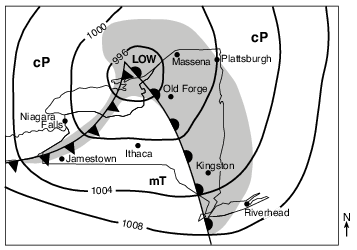
Identify the location labeled on the map that will next experience a short burst of heavy precipitation, a change in wind direction, and a rapid decrease in temperature. [1]
Allow 1 credit for Jamestown.
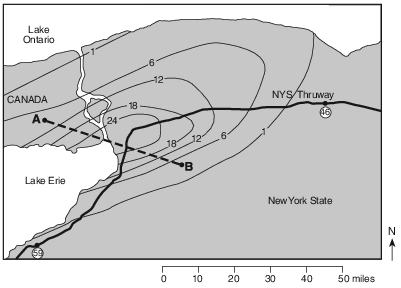
A Lake-Effect Snowstorm
A snowstorm affected western New York State on October 12 and 13, 2006. A blend of weather conditions caused more than 24 inches of heavy, wet, lake-effect snow, bringing much of western New York to a standstill. The New York State Thruway was closed to traffic between exits 46 and 59, which are circled on the map. The isolines on the map show the amount of snowfall, measured in inches, resulting from this storm. Points A and B represent locations on Earth’s surface.
Identify two hazards to human life or property that can result from a snowstorm of this size. [1]
Hazard 1:
Hazard 2:
Allow 1 credit for two acceptable responses. Acceptable responses include, but are not limited to:
• — car accidents
• — power outages
• — damage to homes
• — flooding
• — trees falling on electrical lines/houses/cars
• — heart attack from shoveling
• — carbon monoxide poisoning
• — no heat in the building


State the compass direction in which Hurricane Wilma moved from October 22 through October 25. [1]
Allow 1 credit for NE or northeast or northeastward or for indicating slightly east of northeast.
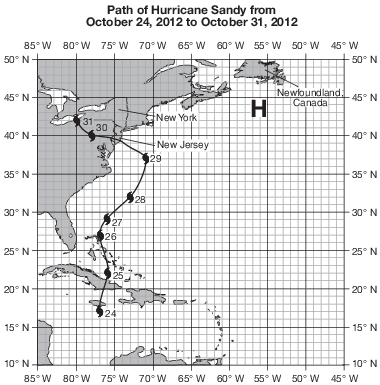
Hurricane Sandy
In October 2012, Hurricane Sandy produced extreme damage to New York City and the coast of New Jersey due to high winds and a high storm surge. A storm surge is the rise in the level of ocean water along a coast that is caused by strong winds blowing toward land from a severe storm. High ocean tides, occurring at the same time, added to the height of the storm surge. A high-pressure center, located just south of Newfoundland, Canada, affected Hurricane Sandy by altering the path of the jet stream. This change in the jet stream, combined with surface wind circulation around the high-pressure center, caused Hurricane Sandy to curve westward, making landfall along the coast of New Jersey.
The data table below shows the air pressure, measured in millibars (mb), and surface wind speed, measured in miles per hour (mi/h), recorded near the center of Hurricane Sandy on three separate days.

On the set of axes in the image below, draw a line to represent the general relationship between air pressure and surface wind speed associated with Hurricane Sandy for these three days. [1]
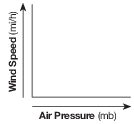
Allow 1 credit for a line showing that, generally, as air pressure increases, wind speed decreases.
• Examples of 1-credit responses:
• 
On the map in the image provided, draw one curved arrow between 0° and 30° N to indicate the direction of prevailing planetary winds between these latitudes. [1]
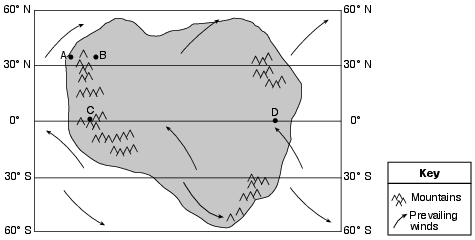
Allow 1 credit for an arrow drawn curving to the right from northeast to southwest between 30° N and 0°.
• Note: If more than one curved arrow is drawn, all must be correctly drawn to receive credit.
• Example of a 1-credit response:
• 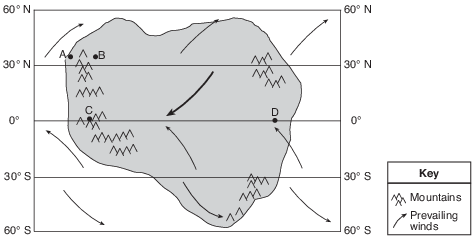
Describe the two characteristics of the general surface wind circulation pattern associated with this low-pressure system. [1]
Characteristic 1: Characteristic 2:
Allow 1 credit for two correct characteristics. The order of the characteristics may vary.. Acceptable responses include, but are not limited to:
• Characteristic 1:
• — Winds blow inward/in.
• — toward the center
• — from higher to lower pressure
• — Surface winds converge.
• Characteristic 2:
• — counterclockwise
• — Winds are cyclonic.