
Topic: Weather Variables
Weather Variables
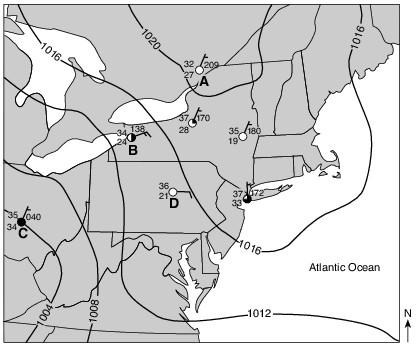
What was the probable air pressure, in millibars, at station D?
(1) 1015.0 mb
(2) 1017.0 mb
(3) 1021.0 mb
(4) 1036.0 mb
A dry-bulb temperature of 30°C and a wet-bulb temperature of 29°C were recorded at a weather station. What are the relative humidity and the most likely weather conditions?
(1) Relative humidity is 29% with clear skies.
(2) Relative humidity is 29% with a good chance of snow.
(3) Relative humidity is 93% with clear skies.
(4) Relative humidity is 93% with a good chance of rain.
What is the dewpoint when the dry-bulb temperature is 12°C and the wet-bulb temperature is 7°C?
(1) 1°C
(2) −5°C
(3) 28°C
(4) 48°C
If the air temperature is 20°C and the relative humidity is 58%, what is the dewpoint?
(1) 5°C
(2) 12°C
(3) 15°C
(4) 38°C
The dewpoint is 15°C. What is the wet-bulb temperature on a sling psychrometer if the dry-bulb temperature is 18°C?
(1) 16°C
(2) 2°C
(3) 3°C
(4) 20°C
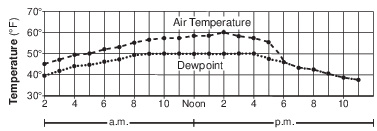
What was the relative humidity at 8:00 p.m.?
(1) 30%
(2) 45%
(3) 75%
(4) 100%
What is the relative humidity of the air when the dry-bulb temperature is 4°C and the dewpoint is −4°C?
(1) 42%
(2) 46%
(3) 51%
(4) 56%
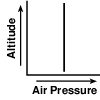
Which graph best shows the general relationship between air pressure and altitude?
(1) 
(2) 
(3) 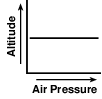
(4) 
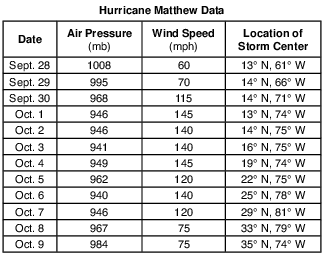
On the map in the image provided, complete the path of Hurricane Matthew by plotting the location of the storm center for October 5 through October 9. Draw a line to connect all five of these plots to the October 4 plot to complete the path. [1]

Allow 1 credit if all five plots are within or touch the circles shown below and are correctly connected with a line (beginning at the 10/4 plot) that passes within or touches each circle.
• Note: Allow credit if the line does not pass through the student plots, but is still within or touching
• the circles.
• It is recommended that an overlay of the same scale as the student answer booklet be used to ensure reliability in rating.
• 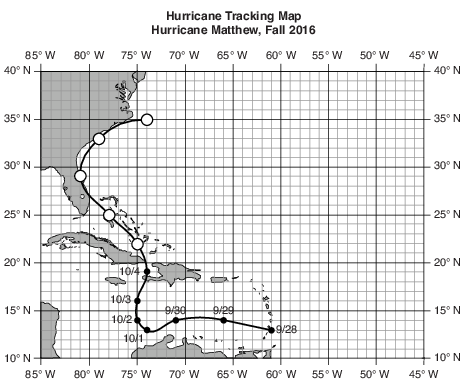
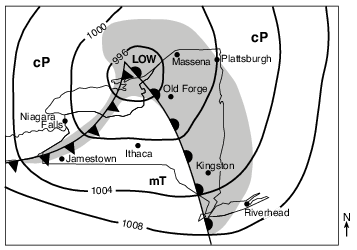
Identify the location labeled on the map that will next experience a short burst of heavy precipitation, a change in wind direction, and a rapid decrease in temperature. [1]
Allow 1 credit for Jamestown.
A Lake-Effect Snowstorm
A snowstorm affected western New York State on October 12 and 13, 2006. A blend of weather conditions caused more than 24 inches of heavy, wet, lake-effect snow, bringing much of western New York to a standstill. The New York State Thruway was closed to traffic between exits 46 and 59, which are circled on the map. The isolines on the map show the amount of snowfall, measured in inches, resulting from this storm. Points A and B represent locations on Earth’s surface.
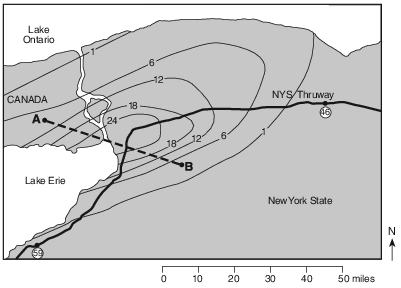
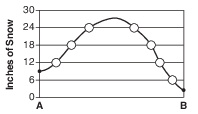
On the grid in the image provided, construct a profile of the snowfall amounts along line AB by plotting the isoline amounts that cross line AB. The amounts for points A and B have been plotted. Complete the profile by connecting all the plots with a line. [1]
Allow 1 credit if all seven student plots are within the circles shown below and are connected with a line from A to B that passes within the circles. The line must extend above 24 inches and below30 inches.
• Note: It is recommended that an overlay of the same scale as the student answer booklet be used
• to ensure reliability in rating.
• 
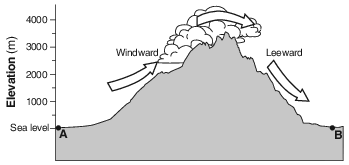
What is the relative humidity at the base (bottom) of the cloud on the windward side of the mountain? [1]
%
Allow 1 credit for 100%.


State the average annual snowfall at location A. [1]
in
Allow 1 credit for any value greater than 100 in but less than 120 in.
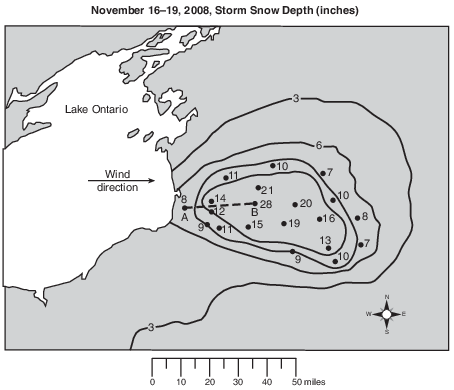
On the map in the image provided, draw the 9-inch and 12-inch snow depth isolines. [1]

Allow 1 credit for correctly drawn 9-inch and 12-inch snow depth isolines. If additional isolines have been drawn, all isolines must be correct to receive credit.
• Example of a 1-credit response:
• 
Convert the air pressure at location A from millibars (mb) to inches of mercury (in of Hg). [1]
______________ in of Hg
Allow 1 credit for 30.12 in of Hg.