
Topic: Human Influences On Basic Processes Of Natural Ecosystems
Human Influences On Basic Processes Of Natural Ecosystems
Which human activity best represents a method for recycling nutrients?
(1) mixing lawn clippings with vegetable waste to produce compost used to fertilize gardens
(2) raking and bagging lawn clippings in plastic bags for disposal in landfills
(3) collecting lawn and garden wastes for burning
(4) clearing a forested area to provide open land for cattle
The chart below summarizes the effect of commercial fishing on a local Atlantic cod population over an 9-year period.
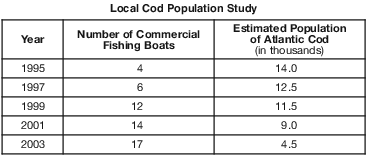
According to the chart, it can be concluded that
(1) the number of fishing boats has less effect on the local cod population than pollution
(2) more fishing boats make the cod population estimates more accurate
(3) an increase in fishing boats has had a positive impact on cod population growth
(4) commercial fishing is having a negative effect on the local cod population
Damage to the ozone shield over the United States is likely to cause
(1) increased warming of local ecosystems
(2) increased exposure to ultraviolet light
(3) reduction in the pH of acid precipitation
(4) reduction in the frequency of floods and droughts

What information would be appropriate to add to box X in order to complete the diagram?
(1) cellular respiration by humans
(2) simple sugar
(3) oxygen
(4) burned by automobiles
Many oak trees are cut down and removed from an oak-hickory forest. A likely result of the direct harvesting of the oak species would be the
(1) disruption of natural cycles
(2) conservation of these natural forest resources
(3) recycling of all the nutrients in the forest
(4) prevention of the extinction of animals native to the area
Microbeads are tiny, smooth, plastic spheres found in common household products such as facial soap. These beads, measuring from 0.0004 to 1.24 mm, roughly the size of some fish eggs, are too small to be removed by water treatment systems. Thus, they end up in rivers, lakes, and other bodies of water. The accumulation of these microbeads is an environmental concern for aquatic biologists because microbeads
(1) make the lakes and rivers cloudy and dirty, affecting their appearance
(2) may stick to some household water pipes, preventing drainage problems
(3) could be mistaken for food by some species, working their way up the food chain
(4) could clog fishing nets, affecting the ability of fishermen to catch fish
When humans place grass clippings and other yard waste in landfills, they are most directly interfering with the natural process of
(1) recycling energy
(2) the production of energy
(3) recycling organic compounds
(4) the production of organic compounds
More than 100 years ago, Earth’s atmosphere contained about 280 parts per million (ppm) of carbon dioxide. It is predicted that by the year 2050, the level of carbon dioxide in the atmosphere could reach 700 ppm, greatly increasing Earth’s temperature. It has been suggested that growing more green plants would help to slow this increase. The best explanation for why increased numbers of plants would help is that plants
(1) serve as food for herbivores
(2) serve as a nonrenewable energy resource
(3) remove carbon dioxide from the atmosphere during respiration
(4) remove carbon dioxide from the atmosphere during photosynthesis
Many communities have started programs to dispose of evergreen trees after the holiday season. These programs allow individuals to bring these trees to be shredded, and the resulting chips are spread around parks and recreational areas as mulch. These programs benefit the environment by
(1) increasing pollution in parks
(2) taking up more space in landfills
(3) returning materials to the environment
(4) increasing carbon dioxide in the atmosphere
Some owners of beautifully landscaped homes along the shores of the Finger Lakes use fertilizer on their lawns. When it rains, some fertilizer is washed into the lakes and causes increased plant growth in the lakes. State one effect that this increased plant growth could have on the aquatic ecosystem. [1]
Allow 1 credit. Acceptable responses include, but are not limited to:
• — Increased plant growth might block sunlight from penetrating the water, killing off other
• plant species.
• — Increased plant growth could disrupt the food chain by blocking light to the ecosystem.
• — There will be a change (increased/decreased) in the oxygen supply for fish.
• — There will be a change (decreased/increased) in the food supply for herbivores.
• — can result in more decaying material causing the lake to fill in
• — Excessive plant growth can limit animal movement/alter habitat.
At an observatory in Mauna Loa, Hawaii, scientists have been measuring and collecting data related to changes in the atmosphere since the 1950s. The remote location of the observatory makes it ideal for studying atmospheric conditions that can cause climate change. One specific measurement taken is the amount of atmospheric carbon dioxide. Information for a 7-year period is shown in the graph below.

Analyze the data shown in the graph. In your answer, be sure to:
• state the overall relationship between time and carbon dioxide levels [1]
• state one possible cause for the overall change in the carbon dioxide levels shown in the graph [1]
• identify the biological process that might account for the decreases in carbon dioxide levels [1]
• identify two actions carried out by humans that could lower carbon dioxide levels [1]
The student’s response to the bulleted items in the question need not appear in the following order.
• 11 Allow 1 credit for stating the overall relationship between time and carbon dioxide levels.
• Acceptable responses include, but are not limited to:
• — As time increased, the levels of carbon dioxide increased.
• — As time went by, the amount of carbon dioxide increased.
• — Carbon dioxide production fluctuated with the seasons.
• 12 Allow 1 credit for stating one possible cause for the overall change in the carbon dioxide levels
• shown in the graph. Acceptable responses include, but are not limited to:
• — increase in human population
• — fewer photosynthetic organisms
• — deforestation
• — increased use of fossil fuels
• — increased volcanic activity
• Note: Do not accept just “pollution” without a source or explanation.
• 13 Allow 1 credit for identifying the biological process that might account for the decreases in carbon
• dioxide levels. Acceptable responses include, but are not limited to:
• — photosynthesis
• — autotrophic nutrition
• 14 Allow 1 credit for identifying two actions carried out by humans that could lower carbon dioxide
• levels. Acceptable responses include, but are not limited to:
• — planting more trees
• — reducing the use of fossil fuels
• — car pool/use public transportation/reduce driving
• — recycling
• — using alternative energy sources
Solid Waste Management Act of 1988
In the Solid Waste Management Act of 1988, the New York State legislature established our State Solid Waste Management Policy. The solid waste management priorities in New York State are:
(a) first, to reduce the amount of solid waste generated; (b) second, to reuse material for the purpose for which it was originally intended or to
recycle material that cannot be reused; (c) third, to recover, in an environmentally acceptable manner, energy from solid waste
that can not be economically and technically reused or recycled; and (d) fourth, to dispose of solid waste that is not being reused, recycled or from which
energy is not being recovered, by land burial or other methods approved by the department.
Identify one factor that would hinder recycling efforts within a community and state how it could be corrected. [1]
Factor:
Correction:
Allow 1 credit. Acceptable responses include, but are not limited to:
• Factor: People won’t recycle.Correction: Fine individuals who put recyclables in their garbage.
• Factor: lack of education about recyclingCorrection: Distribute recycling information or sponsor television and radio ads.
• Factor: too time consumingCorrection: Companies can collect unsorted recyclables.
Dr. Liz Hadly studied the ecology of Yellowstone National Park for 30 years, specifically the amphibians inhabiting the park for 20 of those years. Dr. Hadly studied 46 ponds in 1992-1993. Of these, 43 supported amphibians. From 2006-2008, only 38 of the original 46 ponds contained water. The graph below represents population data for four amphibian species collected by Dr. Hadly during 1992-1993 and 2006-2008.

Explain how global warming could have affected Yellowstone frog and salamander habitats, resulting in changes in the populations of these species. [1]
Allow 1 credit. Acceptable responses include, but are not limited to:
• — Global warming has likely caused eight of the original 46 ponds to dry up. This has reduced
• the size of the habitat available for frogs and salamanders.
• — Global warming has resulted in less rain and snow in Yellowstone. This has resulted in the
• loss of many ponds once inhabited by frogs and amphibians. With a decrease in habitat, there has been a decrease in population size.
• — It could have warmed some of the ponds so much that the amphibians there died/did not
• reproduce.
• — Global warming has decreased the food available for the amphibians.
• Note: Do not accept “that the frogs and salamanders were not adapted” without an explanation.
Over the past few decades, researchers have observed declining numbers in two species of penguins native to the West Antarctic peninsula. New evidence is pointing to a decline in their food supply as the primary cause for the recent drops in their numbers. These penguins feed on krill, small animals that grow and develop under ice masses. The graphs below show data related to two factors: atmospheric carbon dioxide (CO2) levels and Antarctic ice mass. The diagram of a generalized Antarctic food web illustrates the role of the penguins.

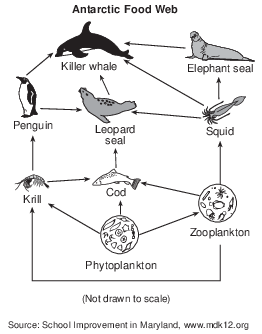
State one possible relationship between CO2 levels and the change in Antarctic ice mass. [1]
Allow 1 credit. Acceptable responses include, but are not limited to:
• — An increase in CO2 levels caused the ice to melt.
• — An increase in CO2 brought about global warming, which melted the ice.
• — As the level of CO2 increased, ice mass decreased.
• — As CO2 increased, the temperature increased, and the ice mass decreased.
Atmospheric Carbon Dioxide
Records from polar ice cores show that the natural range of atmospheric carbon dioxide (CO2) over the past 800,000 years was 170 to 300 parts per million (ppm) by volume. In the early 20th century, scientists began to suspect that CO2 in the atmosphere might be increasing beyond this range due to human activities, but there were no clear measurements of this trend. In 1958, Charles David Keeling began measuring atmospheric CO2 at the Mauna Loa observatory on the big island of Hawaii.
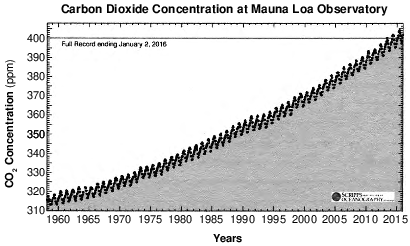
Identify one likely reason for the overall change in CO2 concentration observed between 1958 and 2015. [1]
Allow 1 credit. Acceptable responses include, but are not limited to:
• — The concentration of CO2 increased between 1958 and 2015 due to more CO2 produced
• by burning fossil fuels.
• — There was an increase in CO2 due to more people driving more cars.
• — There has been an increase in the use of fossil fuels.
• — increased industrialization
• — CO2 in the atmosphere increased due to human activities.
• — deforestation
• Note: Do not accept global warming since this is a result rather than the reason for the change.