
Topic: Hypothesis And Experiment Design
Hypothesis And Experiment Design
Before conducting an experiment, two students gathered information about the effect of greenhouse gases on global warming. Student A found information in a newspaper article. Student B found information in several peer-reviewed scientific journals and on three websites.
After gathering the information, the students presented the information to their class. The class gave the students suggestions about how to continue with their experiment. How does this step benefit the investigation?
(1) Feedback from the class will help them design a better experiment.
(2) Feedback creates confusion, and will complicate the investigation.
(3) The students’ investigation will be unaffected because the class is not carrying out the experiment.
(4) The investigation will be unchanged because students can use information only from published sources to design the experiment.
A student designed an experiment to investigate a claim that athletes would have lower heart rates than nonathletes during exercise. After the students classified themselves as an athlete or a nonathlete, their resting pulses were determined. Then all the students performed the same exercise for four minutes and their heart rates were determined by recording the pulse rate in beats per minute. The students continued to measure their pulse rates for an additional four minutes. The average heart rate per minute for each group was determined. The data were recorded, as shown on the table below.
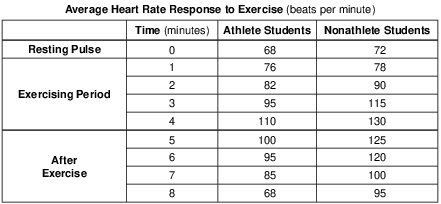
To improve the validity of the conclusion reached in this experiment, the students should repeat the experiment
(1) disregarding any data that don’t fit the hypothesis
(2) with a larger number of athletes and nonathletes
(3) comparing the heart rates and breathing rates of males and females
(4) with the athletes doing different exercises than the nonathletes
Euglena are single-celled organisms that live in ponds. All euglena have chloroplasts and can make their own food. They can also take in food from the environment. The diagram below represents a euglena.
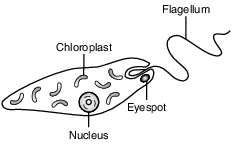
An experiment was set up to determine the effect of nitrates, a pollutant, on the number of chloroplasts present in euglena. Five tanks were set up, each with euglena and a different concentration of nitrate solution: 0%, 0.5%, 1.0%, 1.5%, and 2.0%.
The tanks were placed in a sunny location where each tank received the same amount of light.
Which statement is a possible hypothesis for this experiment that could be supported by the results of this experiment?
(1) If the average number of chloroplasts in euglena decreases, will less nitrate be needed in each tank?
(2) If the nitrate concentration is increased, then the euglena will have a lower average number of chloroplasts.
(3) If the number of euglena in a tank increases, will more nitrates be produced?
(4) If the nitrate concentration is decreased, then more light will reduce the average number of chloroplasts in euglena.
An experiment was carried out to answer the question “Does the pH of water affect the growth of radish plants?” Two groups of ten radish plants were set up. One group was watered with water having a pH of 3.0, and the other group was watered with water having a pH of 7.0. Both groups of plants received the same amount and intensity of light, the same amount of water, and they were grown in the same type of soil. The heights of the radish plants were measured every 2 days for a period of 2 weeks.
Which sentence is a possible hypothesis that was tested in this experiment?
(1) Does the pH of water affect the growth of radish plants?
(2) Will the amount of water alter the heights of the radish plants?
(3) The temperature of the water will affect the heights of the radish plants.
(4) The pH of the water will affect the heights of the radish plants.
In an appropriately designed experiment, a scientist is able to test the effect of
(1) a single variable
(2) multiple variables
(3) the hypothesis
(4) scientific observations
Daphnia are freshwater organisms sometimes referred to as “water fleas.” Design an experiment that could be used to test the effects of temperature on the size of a daphnia population. In your experimental design, be sure to:
• state a hypothesis to be tested [1]
• describe how the control group will be treated differently from the experimental group [1]
• identify the independent variable in the experiment [1]
• identify the type of data that will be collected [1]
The student’s response to the bulleted items in the question need not appear in the following order.
• 6 Allow 1 credit for stating a hypothesis to be tested. Acceptable responses include, but are not
• limited to:
• — As temperature increases, the daphnia population decreases.
• — Temperature has an effect on the size of a daphnia population.
• — If the temperature decreases, then the size of the daphnia population decreases.
• Note: Do not allow credit for a hypothesis written in the form of a question.
• 7 Allow 1 credit for describing how the control group will be treated differently from the
• experimental group. Acceptable responses include, but are not limited to:
• — The control group will be at normal temperature for the species.
• — The control group will be at normal freshwater pond temperature, while the experimental
• groups will be at other temperatures.
• 8 Allow 1 credit for identifying the independent variable in the experiment as temperature.
• 9 Allow 1 credit for identifying the type of data that will be collected. Acceptable responses include,
• but are not limited to:
• — change in the number of daphnia in the population
• — number of daphnia at each temperature
• Note: The type of data must be measurable.
Scientists have been experimenting with different forms of alternate energy to help reduce the amount of fossil fuels that are burned. They studied yeast, which convert plant materials into ethanol, a form of alcohol that can be used in automobiles. These experi- ments were carried out at room temperature. The scientists wondered whether more ethanol would be produced at different temperatures.
Design an experiment to determine the effect of temperature on ethanol production by yeast. In your answer, be sure to:
• state one hypothesis the experiment would test [1]
• state how the control group would be treated differently from the experimental group [1]
• identify two factors that must be kept the same in both the experimental and control groups [1]
• identify the independent variable in the experiment [1]
The student’s response to the bulleted items in the question need not appear in the following order.
• 10 Allow 1 credit for stating one hypothesis the experiment would test. Acceptable responses include,
• but are not limited to:
• — Increasing the temperature will increase the rate of ethanol production.
• — Decreasing the temperature will increase the rate of ethanol production.
• — Temperature affects the rate of ethanol production.
• Note: Do not allow credit for a hypothesis written in the form of a question.
• 11 Allow 1 credit for stating how the control group would be treated differently from the experi-
• mental group. Acceptable responses include, but are not limited to:
• — The control group will be kept at room temperature, while the experimental group will be
• kept at a higher/lower temperature.
• — The control group would be kept at room temperature.
• Note: Allow credit for an answer consistent with the student’s hypothesis for question 61.
• 12 Allow 1 credit for identifying two factors that must be kept the same in both the experimental and
• control groups. Acceptable responses include, but are not limited to:
• — amount of yeast used
• — amount of plant material used
• — type of plant material used
• — species of yeast used
• Note: Allow credit for an answer consistent with the student’s hypothesis for question 61.
• 13 Allow 1 credit for identifying the independent variable in the experiment as temperature.
• Note: Allow credit for an answer consistent with the student’s hypothesis for question 61.
The presence of air is believed to be important for root growth in bean plants. The apparatus available to conduct an investigation is shown below. There are enough bottles and other materials to have multiple setups. Air (for aeration) can be bubbled into the bottle through the rubber tube.

Design an experiment to test the effect of aeration on the growth of roots of bean seedlings. In your answer, be sure to:
• state one hypothesis the experiment would test [1]
• describe how the control group will be treated differently from the experimental group [1]
• identify the dependent variable in the experiment [1]
• state one reason why many setups should be used in both the experimental and control groups [1]
• state one reason why several different kinds of seedlings were not tested in this experiment [1]
The student’s response to the bulleted items in the question need not appear in the following order.
• 14 Allow 1 credit for stating one hypothesis the experiment would test. Acceptable responses include,
• but are not limited to:
• — Roots of bean plant seedlings grown in aerated nutrient solution will grow faster than roots
• of seedlings grown without aeration of the nutrient solution.
• — Bubbling air into the nutrient solution will lead to more root growth.
• — If air is bubbled into the nutrient solution, then the roots will grow more rapidly.
• — Air is important for root growth in bean plants.
• Note: Do not allow credit for a hypothesis written in the form of a question.
• 15 Allow 1 credit for describing how the control group will be treated differently from the
• experimental group. Acceptable responses include, but are not limited to:
• — The control group will have no aeration.
• — No air will be pumped through the rubber tube.
• 16 Allow 1 credit for identifying the dependent variable in the experiment. Acceptable responses
• include, but are not limited to:
• — number of roots
• — length of roots
• — rate of root growth
• Note: Allow credit for an answer consistent with the student’s hypothesis in question 14 .
• 18 Allow 1 credit for stating one reason why many setups should be used in both the experimental and
• control groups. Acceptable responses include, but are not limited to:
• — Many setups provide more data for drawing a valid conclusion.
• — so your conclusion will be valid
• 19 Allow 1 credit for stating one reason why several different kinds of seedlings were not tested in this
• experiment. Acceptable responses include, but are not limited to:
• — This experiment was done to test the presence of air on root growth in bean seedlings
• only.
• — There should be only one variable.
Poison ivy is a weed that grows in New York State. It synthesizes an oil, urushiol, that causes skin rashes. Researchers have found that if poison ivy grows in an environment that contains an increased concentration of carbon dioxide, the plants grow larger, faster, and produce more urushiol. Because carbon dioxide levels in the atmosphere are rising, poison ivy might become a hazard to people who work or vacation outdoors.
In order to verify this research, experiments must be carried out. Design an experiment to test whether poison ivy is affected by air containing higher than normal concentrations of carbon dioxide. In your answer, be sure to:
• state the hypothesis the experiment would test [1]
• state one way the control group should be treated differently from the experimental group [1]
• identify two conditions that should be kept the same in both the control and the experimental groups [1]
• describe the type of data to be collected [1]
• identify one safety precaution that should be taken during the experiment and explain why it is necessary [1]
The student’s response to the bulleted items in the question need not appear in the following order.
• 19 Allow 1 credit for stating the hypothesis the experiment would test. Acceptable responses include, but are not limited to:
• — If poison ivy grows in a place with a higher than normal concentration of carbon dioxide, then it will grow taller.
• — In high concentrations of carbon dioxide, poison ivy will grow faster.
• — Large concentrations of carbon dioxide will cause poison ivy to produce more urushiol.
• — Different concentrations of carbon dioxide will affect the growth rate of poison ivy plants.
• Note: Do not allow credit for a hypothesis written in the form of a question.
• 20 Allow 1 credit for stating one way the control group should be treated differently from the experimental group. Acceptable responses include, but are not limited to:
• — The experimental group would be exposed to a higher than normal concentration of carbon dioxide. The control group would be exposed to the same level as before (normal level).
• — The control group would have plants growing at normal carbon dioxide level.
• — The experimental group would have plants growing at a higher carbon dioxide level.
• Note: Do not allow credit for the control receiving no carbon dioxide.
• 21 Allow 1 credit for identifying two conditions that should be kept the same in both the control and the experimental groups. Acceptable responses include, but are not limited to:
• — The soil should be the same.
• — amount of water is the same
• — same species of plant used
• — The length of exposure to daylight should be the same.
• — the initial size of plants
• 22 Allow 1 credit for describing the type of data to be collected. Acceptable responses include, but are not limited to:
• — heights of plants
• — average number of plant leaves
• — total mass of plants
• — size of leaves on the plants
• — amount of urushiol produced
• Note: Allow credit for an answer consistent with the student’s hypothesis for question 56. The type of data must be measurable and must relate to the student’s hypothesis for question 56.
• 23 Allow 1 credit for identifying one safety precaution that should be taken during the experiment and explaining why it is necessary. Acceptable responses include, but are not limited to:
• — Wear gloves to avoid exposure to the oil (urushiol).
• — Wear goggles to protect your eyes from the oil.
• — Avoid direct contact with poison ivy to avoid getting a rash.
Some poinsettia plants have green leaves that turn red. A garden club decided to study the color change of poinsettia plants. Knowing that poinsettias change color during the short daylight periods of winter, they decided to investigate the effect of different daylight lengths on color change.
Design a controlled experiment using three experimental groups that could be used to determine if the number of hours of daylight has an effect on the color change of poinsettias. In your experimental design, be sure to:
• state one hypothesis the experiment would test [1]
• state one way the three experimental groups would differ [1]
• identify two factors that must be kept the same in all three groups [1]
• identify the dependent variable in the experiment [1]
• describe experimental results that would support your hypothesis [1]
The student’s response to the bulleted items in the question need not appear in the following order.
• 24 Allow 1 credit for stating one hypothesis the experiment would test. Acceptable responses include,
• but are not limited to:
• — If plants are exposed to fewer than 11 hours of daylight, then they will change color.
• — The number of hours of daylight will have no effect on color change.
• Note: Do not allow credit for a hypothesis written in the form of a question.
• 25 Allow 1 credit for stating one way the three experimental groups would differ. Acceptable responses
• include, but are not limited to:
• — One group gets less than 10 hours of daylight, one more than 12 hours of daylight, and one11 hours of daylight.
• — exposure to different lengths of daylight
• 26 Allow 1 credit for identifying two factors that must be kept the same in all the three groups.
• Acceptable responses include, but are not limited to:
• — temperature
• — amount of water/fertilizer
• — soil conditions
• — age/size of plants
• 27 Allow 1 credit for identifying the dependent variable in the experiment. Acceptable responses
• include, but are not limited to:
• — leaf color
• — whether or not color changes
• 28 Allow 1 credit for describing experimental results that would support the hypothesis. Acceptable
• responses include, but are not limited to:
• — The hypothesis would be supported if only the plants exposed to less than 10 hours of day-
• light change color and those exposed to more hours of daylight do not change color.
• — All of the plants changed color/none of the plants changed color.
• Note: Allow credit for an answer that is consistent with the student’s response to question 24 .
Super-Size It?
The American Academy of Pediatrics has noted an increase in the population of children with disorders that are usually associated with older adults, such as diabetes. Observers of American culture point to the trend to “super-size” food servings as a possible cause. Larger servings might encourage children of today to eat more fats and sugars than children ate a generation ago.
In an attempt to determine if there is a relationship between diet and the development of diabetes in children, a study was done which surveyed a group of children regarding their eating habits and whether or not they were diabetic. When the survey results were collected, the data were used to organize the children into two groups based on their responses, and then the data were analyzed.
Discuss this investigation. In your answer, be sure to:
• state the hypothesis being tested in this investigation [1]
• identify one survey response that was most likely used for organizing the children into two groups [1]
• state what survey results would support the hypothesis stated above [1]
The student’s response to the bulleted items in the question need not appear in the following order.
• 29 Allow 1 credit for stating the hypothesis being tested in this investigation. Acceptable responses
• include, but are not limited to:
• — Eating a diet with excessive amounts of fats and sugars has no connection with developing diabetes.
• — Children who are diabetic have been eating more “super-sized” portions than those who are not.
• — Children who are diabetic have been (or have not been) eating greater amounts of fats and sugars compared to those who are not.
• — If children eat more fats and sugars, then they are more likely to be diabetic or have disorders.
• — There is a relationship between diet and diabetes.
• Note: Do not allow credit for a hypothesis in the form of a question.
• 30 Allow 1 credit for identifying one survey response that was most likely used for organizing the children into two groups. Acceptable responses include, but are not limited to:
• — The children were divided based on whether or not they were diabetic.
• — The children were divided based on whether or not they ate “super-sized” portions.
• — The children were divided based on different eating habits.
• 31 Allow 1 credit for stating what survey results would support the hypothesis stated above.
• Responses will vary based on the specific hypothesis stated and how the student proposed organizing the children into two groups. Acceptable responses include, but are not limited to:
• If a connection between diabetes and diet was hypothesized:
• — There would be data showing that more diabetic children ate more fats and sugars than children who were not diabetic.
• If no connection was hypothesized:
• — The data would show that about as many children with diabetes would have eaten more fats and sugars as children who were not diabetic.
Secondhand Smoke and Estrogen
A fertility researcher conducted a study of pregnant women. The researcher’s hypothesis was that the estrogen levels of pregnant women who were exposed to daily secondhand cigarette smoke would be higher than estrogen levels of pregnant women not exposed to daily secondhand smoke.
The researcher measured the estrogen levels of eight pregnant women each week throughout their pregnancy. Four of the women lived in houses with heavy smokers, the other four did not. The women’s ages varied from 19 to 42 years old. Six of the women were pregnant with girls, one was pregnant with a boy, and one was pregnant with twin boys. The research was submitted for peer review.
Analyze this experiment. In your answer, be sure to:
• identify one error in the researcher’s experimental design [1]
• identify one way, other than affecting estrogen levels, that secondhand smoke could affect a developing embryo [1]
• explain why the process of peer review is an important step in this research [1]
The student’s response to the bulleted items in the question need not appear in the following order.
• 32 Allow 1 credit for identifying one error in the researcher’s experimental design. Acceptable
• responses include, but are not limited to:
• — The sample size for the experiment was too small.
• — There were not enough women in the study.
• — The range of ages added a second variable.
• — There were fetuses of different genders.
• — There were too many variables.
• 33 Allow 1 credit for identifying one way, other than affecting estrogen levels, that secondhand smoke could affect a developing embryo. Acceptable responses include, but are not limited to:
• — It could lead to miscarriages/premature labor/birth.
• — The babies born could have a lower birth weight.
• — They could have asthma/birth defects/addiction.
• — They might receive less oxygen/nutrients.
• 34 Allow 1 credit for explaining why the process of peer review is an important step in this research.
• Acceptable responses include, but are not limited to:
• — Other scientists may find errors that the original researchers did not.
• — Other scientists could repeat the experiment to confirm the result.
• — Peer review allows other researchers to evaluate the results of an experiment.
• — Peer review improves the validity of the study.
Ticks, such as deer ticks and dog ticks, feed on the blood of humans and other animals. Part of the feeding process involves the tick injecting its saliva to help make blood flow. In the process, they sometimes spread disease organisms to their host. Sometimes ticks get on clothing, and can remain there for a few days before actually biting their host.
A scientist found that ticks might be able to survive even when exposed to hot water and detergent in a washing machine.
Students designed the experiment below to test how well ticks survive a hot-water washing machine cycle with detergent. Note that some details of the design are incorrect.

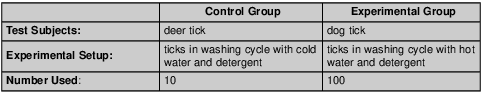
Identify one error with the hypothesis. [1]
Allow 1 credit. Acceptable responses include, but are not limited to:
• — It is written in the form of a question.
• — It is not a prediction.
African violet plants are grown for their delicate, colorful flowers and furry, soft leaves. People often want to touch the leaves and brush the hairy leaves with their fingers. Growers and plant owners were concerned that this could negatively affect the plant. Of particular concern was the presence of body lotion or other skin products on the hands of persons touching the leaves.
A student thought this might be the basis of a science project. He selected two African violet plants. Ten leaves on each of the two plants were brushed with a gloved hand for 30 seconds, once a day, for a period of five days. The difference was that leaves of the second plant were brushed with a gloved hand that had hand lotion applied to the glove.
As part of the peer review process, evaluate the student’s experiment. As part of your evaluation, be sure to:
• state one possible hypothesis for the experiment proposed by the student [1]
• describe the type of data that should be collected to determine if the brushing with lotion was having a negative effect on the African violet plant [1]
The student’s response to the bulleted items in the question need not appear in the following order.
• 36 Allow 1 credit for stating one possible hypothesis for the experiment proposed by the student.
• Acceptable responses include, but are not limited to:
• — The presence of lotion on the leaves will slow the growth of the plants.
• — If the leaves of an African violet plant are rubbed with body lotion, growth will be reduced.
• — Lotion brushed on the leaves of an African violet plant will have no effect on the leaves.
• — Lotion on the leaves has a negative effect on plants.
• Note: Do not allow credit for a hypothesis written in the form of a question.
• 37 Allow 1 credit for describing the type of data that should be collected to determine if brushing with lotion was having a negative effect on the African violet plant. Acceptable responses include, but are not limited to:
• — the number of leaves that wilted during the five-day period
• — the growth of each plant measured in centimeters
• — the number of leaves that dropped off/turned yellow
• — size of area of damage on leaves
• — the number of damaged leaves
• — change in size of the leaves brushed on each plant
• Note: The type of data must be measurable.
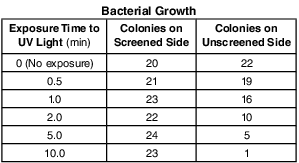
An experiment was carried out to determine the effect of exposure to ultraviolet (UV)
light on the growth of bacteria. Equal quantities of bacterial cells were spread on Petri dishes that are used to grow colonies of bacteria. Half of each dish was shielded from the UV light with a UV screen. The other half was exposed to UV light for various amounts of time. After the UV treatment, the bacteria were grown in an incubator for 24 hours and the number of colonies was counted.

The table below contains the data collected at different exposure times by counting the number of bacterial colonies on both the screen-covered side and unscreened side
Analyze the experiment that produced the data in the table. In your answer, be sure to:
• state a hypothesis for the experiment [1]
• state whether the results of the experiment support or fail to support your hypothesis. Support your answer [1]
The student’s response to the bulleted items in the question need not appear in the following order.
• 38 Allow 1 credit for stating a hypothesis for the experiment. Acceptable responses include, but are
• not limited to:
• — If bacteria are exposed to UV light, they will form fewer colonies than those not exposed.
• — Longer exposure to UV light will limit bacterial growth.
• — Exposure to UV light affects the growth of bacteria.
• — If bacteria are exposed to UV light, they will not form colonies.
• — Bacteria protected from UV light will produce more colonies.
• Note: Do not allow credit for a hypothesis written in the form of a question.
• 39 Allow 1 credit for stating whether the results of the experiment support or fail to support the
• student’s hypothesis and supporting the answer. Acceptable responses include, but are not limited to:
• — The experiment supports the hypothesis that longer exposure to UV light limits bacterial
• growth, since fewer colonies grew with longer exposure to UV light.
• — Support, because more exposure to UV light resulted in fewer bacterial colonies.
• Note: Allow credit only for an answer that is consistent with the student’s response to question 38 .