
Topic: Lab Appendix A Laboratory Check List
Lab Appendix A Laboratory Check List
Euglena are single-celled organisms that live in ponds. All euglena have chloroplasts and can make their own food. They can also take in food from the environment. The diagram below represents a euglena.
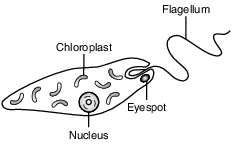
An experiment was set up to determine the effect of nitrates, a pollutant, on the number of chloroplasts present in euglena. Five tanks were set up, each with euglena and a different concentration of nitrate solution: 0%, 0.5%, 1.0%, 1.5%, and 2.0%.
The tanks were placed in a sunny location where each tank received the same amount of light.
Which statement correctly identifies a variable in this experiment?
(1) The independent variable is the concentration of nitrate solution used.
(2) The dependent variable is the number of euglena placed in the tanks.
(3) The independent variable is the amount of sunlight.
(4) The dependent variable is the number of tanks used.
The diagram below represents the measurement of a biological specimen.
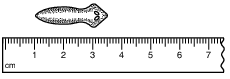
What is the approximate length of the specimen in millimeters?
(1) 25 mm
(2) 30 mm
(3) 35 mm
(4) 40 mm
How much water should be added to the graduated cylinder shown below to increase the volume to 15 milliliters?
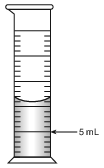
(1) 11 mL
(2) 10 mL
(3) 3 mL
(4) 4 mL
The diagram below represents a specimen in the low-power field of view of a compound light microscope.

If the slide is not moved, which view best represents the way the specimen will look when the high-power objective lens is switched into place?
(1) 
(2) 
(3) 
(4) 
In recent years, biologists have noticed that honeybees responsible for pollinating food crops across the United States are dying at an alarming rate. Farmers, economists, and biologists are very worried about the impact that the loss of honeybees might have on the food supply.

Based on this information and the graph provided, which crops are most at risk if honeybees continue to decline?
(1) strawberries, peanuts, and grapes
(2) almonds, apples, and blueberries
(3) almonds, oranges, and soybeans
(4) peaches, cotton, and grapes
Hydrogen peroxide (H2O2), a byproduct of cellular metabolism, is broken down by the enzyme catalase which is produced by nearly all organisms. When catalase is added to hydrogen peroxide, a reaction occurs that produces bubbles of oxygen gas (O2) and water (H2O).
2H2O2 → 2H2O + O2
The laboratory setup represented below was used to investigate the effect of pH on the breakdown of H2O2. Five setups were made with H2O2 solutions, each at a different pH level.
Catalase was added to the solution in the first setup and the reaction proceeded for one minute and the amount of gas produced by the reaction was recorded on the data table. This exact procedure was repeated with the other four setups containing different H2O2 solutions.


Directions: Using the information in the data table, construct a bar graph on the grid provided, following the directions below.
Based on the investigation, the student should conclude that enzymes
(1) function best within a specific range of conditions
(2) function best when observed in living cells
(3) are not affected by changes in environmental factors
(4) are easily broken down by hydrogen peroxide
In order to determine the effect of a certain antibiotic on a species of microorganism, an investigation was carried out. A sample of a specific species of microorganism was added to 100 mL of a liquid culture medium. One mL of a solution of the antibiotic was then added to that culture medium. Each day at 10 a.m., 1 mL of the experimental culture medium was removed and the number of microorganisms in the 1-mL sample was determined. The 1 mL of experimental culture medium was replaced by 1 mL of new sterile culture medium to maintain a constant volume. The results are shown in the table below.

Directions: Using the information in the data table, construct a line graph on the grid, following the directions below.
Why was the 1 mL of experimental culture medium that was removed each day replaced by 1 mL of sterile culture medium? [1]
Allow 1 credit. Acceptable responses include, but are not limited to:
• — to maintain a constant volume in the container of experimental culture medium
• — to lower the concentration of wastes
• — so it did not add more microorganisms to it
• — to replace nutrients that were removed

The image of the specimen viewed using high power with this microscope will appear larger than when viewed using low power. State one other way the image of the specimen as seen using high power would differ from the image as seen using low power. [1]
Allow 1 credit. Acceptable responses include, but are not limited to:
• — More detail will be seen.
• — You might not see the entire specimen in the field of view.
• — The image might appear darker.
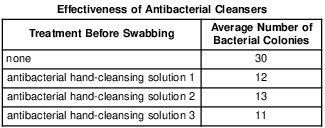
A Study of Antibacterial Cleansers
An experiment was designed to test the effectiveness of three antibacterial hand-cleansing solutions against bacteria present on hands. Swabs were used to take one sample each from the unwashed hands of ten test subjects. Each swab was then rubbed across the surface of bacterial growth medium in a separate petri dish. The dishes were placed in an incubator to allow bacterial colonies to develop.
Ten other test subjects treated their hands with an antibacterial hand-cleansing solution, then had their hands swabbed, and ten more petri dishes were set up and incubated in the same way as the first set of dishes.
The process was repeated again with ten more test subjects for a second hand cleanser, and again for a third group with a third hand cleanser.
The results from the incubated petri dishes were averaged. The averages are shown in the data table below.
What was the purpose of testing unwashed hands? [1]
Allow 1 credit. Acceptable responses include, but are not limited to:
• — to have a group for comparison
• — to use the unwashed group as a control
• — to see what would happen without the treatment
• — the control
Daphnia are freshwater organisms sometimes referred to as “water fleas.” Design an experiment that could be used to test the effects of temperature on the size of a daphnia population. In your experimental design, be sure to:
• state a hypothesis to be tested [1]
• describe how the control group will be treated differently from the experimental group [1]
• identify the independent variable in the experiment [1]
• identify the type of data that will be collected [1]
The student’s response to the bulleted items in the question need not appear in the following order.
• 10 Allow 1 credit for stating a hypothesis to be tested. Acceptable responses include, but are not
• limited to:
• — As temperature increases, the daphnia population decreases.
• — Temperature has an effect on the size of a daphnia population.
• — If the temperature decreases, then the size of the daphnia population decreases.
• Note: Do not allow credit for a hypothesis written in the form of a question.
• 11 Allow 1 credit for describing how the control group will be treated differently from the
• experimental group. Acceptable responses include, but are not limited to:
• — The control group will be at normal temperature for the species.
• — The control group will be at normal freshwater pond temperature, while the experimental
• groups will be at other temperatures.
• 12 Allow 1 credit for identifying the independent variable in the experiment as temperature.
• 13 Allow 1 credit for identifying the type of data that will be collected. Acceptable responses include,
• but are not limited to:
• — change in the number of daphnia in the population
• — number of daphnia at each temperature
• Note: The type of data must be measurable.
Scientists will often grow bacteria in prepared petri dishes. In some experiments, the petri dish will also contain paper disks soaked in a particular antibiotic. The area where the bacteria do not grow is called the zone of inhibition, or ZOI. The diameter of the ZOI indicates the effectiveness of the antibiotic.
The ZOI data collected by one scientist while trying to determine which disk (A, B, C, or D) is most effective at killing Streptococcus bacteria are: Disk D–9 mm, Disk B–8 mm, Disk C–0 mm.
Using the metric ruler represented below, determine the diameter in millimeters (mm) of the ZOI for antibiotic disk A shown below. [1]

ZOI Disk A ___________________ mm
Allow 1 credit for 13 mm (+/– 2mm).
• Note: Do not allow credit for a student response in centimeters.
Information From the Cat Gene Database
A database is being used to trace the evolutionary history of wild and domestic cats. Comparisons show that there are very few differences between the genes present in domestic cats and the genes present in wild cats, such as tigers and lions. Research has also shown that wild cats and domestic cats last shared a common ancestor about 11 million years ago. Since then, there has been very little change in the entire cat genome (the complete set of genes for all the species). This indicates that the cats are well-adapted to change. Yet, there are some important differences.
Big cats share about 1,376 genes that set them apart from other animals. These genes are related to muscle strength and the ability to digest protein. In addition, there are genes that have been found in specific cats that live in specific environments. Genes related to smell, visual perception, and nerve development are evolving rapidly in Siberian tigers. Snow leopards have three mutations related to the use of oxygen at high altitudes. The database is also being used to study diversity within various cat species.
Discuss the importance of establishing a genome database for a cat species. In your answer, be sure to:
• state one example of a genetic variation that is important for the survival of one specific cat species [1]
• identify a specific technique that can be used to analyze the genomes of organisms and explain how the results are used [1]
• explain how genes for a trait, such as a specific fur color, can increase in frequency in a population over time [1]
The student’s response to the bulleted items in the question need not appear in the following order.
• 15 Allow 1 credit for stating one example of a genetic variation that is important for the survival of one specific cat species. Acceptable responses include, but are not limited to:
• — Siberian tigers have genes that increase their ability to smell prey.
• — Snow leopards have mutations related to the use of oxygen at high altitudes.
• — A lion that is more muscular has a better chance of catching prey.
• 16 Allow 1 credit for identifying a specific technique that can be used to analyze the genomes of organisms and for explaining how this technique is used. Acceptable responses include, but are not limited to:
• — Electrophoresis can be used to study the DNA patterns of organisms. The resulting bands can be used to compare the genetic makeup of the organisms.
• — Genes can be cut from the DNA of organisms using special enzymes and can then be analyzed/compared with each other.
• — Bioinformatics can be used to compare a data set with a reference genome.
• Note: Do not allow credit for biotechnology. It is a field of science, not a technique.
• 17 Allow 1 credit for explaining how genes for a trait, such as a specific fur color, can increase in a population. Acceptable responses include, but are not limited to:
• — Certain traits help the big cats survive in the environment; as a result, they are able to reproduce and pass on the genes for the trait to their offspring.
• — When more cats with a certain fur color trait survive and reproduce, the number of big cats with genes for the trait increases.
• — The cats with a specific fur color gene are more successful at catching prey than those without it. They then pass this on to their offspring.
• — The fur color makes them more successful in mate selection. They reproduce and pass on the fur color.
• — Natural selection can lead to beneficial traits increasing in frequency.
Scientists have been experimenting with different forms of alternate energy to help reduce the amount of fossil fuels that are burned. They studied yeast, which convert plant materials into ethanol, a form of alcohol that can be used in automobiles. These experi- ments were carried out at room temperature. The scientists wondered whether more ethanol would be produced at different temperatures.
Design an experiment to determine the effect of temperature on ethanol production by yeast. In your answer, be sure to:
• state one hypothesis the experiment would test [1]
• state how the control group would be treated differently from the experimental group [1]
• identify two factors that must be kept the same in both the experimental and control groups [1]
• identify the independent variable in the experiment [1]
The student’s response to the bulleted items in the question need not appear in the following order.
• 18 Allow 1 credit for stating one hypothesis the experiment would test. Acceptable responses include,
• but are not limited to:
• — Increasing the temperature will increase the rate of ethanol production.
• — Decreasing the temperature will increase the rate of ethanol production.
• — Temperature affects the rate of ethanol production.
• Note: Do not allow credit for a hypothesis written in the form of a question.
• 19 Allow 1 credit for stating how the control group would be treated differently from the experi-
• mental group. Acceptable responses include, but are not limited to:
• — The control group will be kept at room temperature, while the experimental group will be
• kept at a higher/lower temperature.
• — The control group would be kept at room temperature.
• Note: Allow credit for an answer consistent with the student’s hypothesis for question 61.
• 20 Allow 1 credit for identifying two factors that must be kept the same in both the experimental and
• control groups. Acceptable responses include, but are not limited to:
• — amount of yeast used
• — amount of plant material used
• — type of plant material used
• — species of yeast used
• Note: Allow credit for an answer consistent with the student’s hypothesis for question 61.
• 21 Allow 1 credit for identifying the independent variable in the experiment as temperature.
• Note: Allow credit for an answer consistent with the student’s hypothesis for question 61.
Smoking is Dumb
A study by Prof. Mark Weiner of Tel Aviv University’s Department of Psychiatry and the Sheba Medical Center of Tel Hashomer Hospital has determined that young men who smoke are likely to have lower IQs than their nonsmoking peers. Tracking 18- to 21-year- old men enlisted in the Israeli army in the largest study of its kind, he has been able to demonstrate an important connection between the number of cigarettes young males smoke and their IQ.
The average IQ for a nonsmoker was about 101, while the smokers’ average was more than seven IQ points lower at about 94, the study determined. The IQs of young men who smoked more than a pack a day were lower still, at about 90. An IQ score in a healthy population of such young men, with no mental disorders, falls within the range of 84 to 116.
Source: Science Daily April 2, 2010
Based on the information given in the passage, state the relationship between the number of cigarettes young males smoke and their IQ. [1]
Allow 1 credit. Acceptable responses include, but are not limited to:
• — The more cigarettes a young man smokes, the lower his IQ.
• Note: Allow credit only for responses that address the number/quantity of cigarettes smoked.
Two views through a compound light microscope of a wet-mount slide preparation of cells are shown in the photographs below.
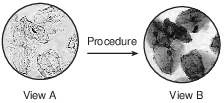
Which procedure was most likely followed to obtain view B? [1]
Allow 1 credit. Acceptable responses include, but are not limited to:
• — adjusting the diaphragm
• — staining
• — adding iodine
• — adjusting the light