Topic: Lab Relationships And Biodiversity
Lab Relationships And Biodiversity
The materials represented in the diagram below were used in a laboratory activity.
These materials were used to carry out the technique known as
(1) DNA staining
(2) genetic engineering
(3) paper chromatography
(4) glucose testing
A student performed a gel electrophoresis experiment. The results are represented in the diagram below.
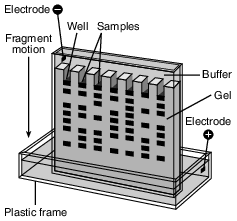
Compared to the fragments at the top of the gel, the fragments at the lower end are
(1) larger, and move slower
(2) larger, and move faster
(3) smaller, and move faster
(4) smaller, and move slower
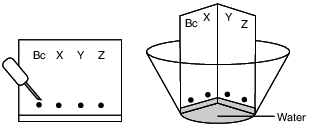
A laboratory setup that can be used to provide information about relationships between four plant species is represented below.
This setup is part of the technique known as
(1) electrophoresis
(2) biological staining
(3) dissection
(4) chromatography
Which chemicals are used to cut DNA into fragments for a gel electrophoresis procedure?
(1) enzymes
(2) molecular bases
(3) hormones
(4) ATP molecules
Paper chromatography is a method used in
(1) comparing the shapes of plant leaves
(2) separating mixtures of plant pigments
(3) comparing habitats of different plants
(4) separating individual DNA fragments of plants
Seriously, We’re Poisonous: Coloration Is An Honest Signal
Of Toxicity In Poison Frogs
The conspicuous [noticeable] colors of poisonous frogs serve as a warning to predators: Don’t eat me; I’m toxic. And a new study shows that in the case of at least one frog species, they aren’t bluffing–the more conspicuous the color, the more poisonous the frog. Researchers Martine Maan (University of Groningen, the Netherlands) and Molly Cummings (University of Texas) studied strawberry poison dart frogs, which are native to Panama and come in more than a dozen different color patterns that vary from region to region.…
…Maan and Cummings tested the toxicity levels of 10 differently colored frog populations. Then using known properties of birds’ visual systems, the researchers estimated how each color pattern would look to a bird, an important frog predator. The results show that frogs with more conspicuous color patterns–as seen by birds–tended to be more toxic. The findings suggest that “birds can predict the toxicity of frogs by looking at their colors, possibly better than the frogs can themselves,” Maan said.…
Source: http://www.ineffableisland.com/2012/01/seriously-were-poisonous-coloration-is.html
If a sudden genetic mutation in the birds that feed on these frogs made them able to consume any amount of the poison with no harm to them, it is most likely that
(1) the frogs that are least poisonous and less conspicuous now would survive better than those that have more poison
(2) the frogs that are most poisonous would continue to survive and be protected by the poison they contain
(3) without the protection of the poison, all of the frogs would need to change color to become less conspicuous
(4) the birds would find another source of food that does not contain any poison
A procedure used in paper chromatography is represented below:
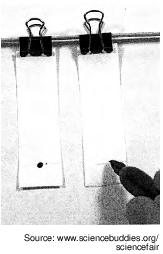
The student is preparing two strips of paper for a chromatography activity. After adding a dot of the ink from the marker pen to the line on the paper on the right, the next step should be to place the strips in a beaker of solvent with the solvent level
(1) between the bottom of the paper and the dot of ink
(2) even with the dot of ink on the paper
(3) just below the bottom edge of the paper
(4) slightly above the dot of ink on the paper
A student is viewing a plant stem cross section using a compound light microscope.
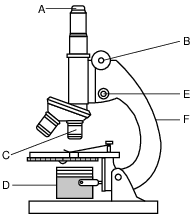
What parts of the microscope should the student use to bring the image into focus?
(1) A and F
(2) B and E
(3) C and D
(4) D and F
The sequences below represent the same portions of a DNA molecule from the same gene used by a student to study the relationship between two plant species. A biological catalyst that recognizes the CCGG site is used to cut the DNA molecules into pieces. The catalyst cuts the DNA between the C and G of the site.
Draw lines in the sequences below for species 1 and species 2 to show where the catalyst would cut the DNA. [1]
Species 1: T A C C G G A T T A G T T A T G C C G G A T C G
Species 2: T A C G G A T G C C G G A T C G G A A A T T C G
Allow 1 credit.
• Example of a 1-credit response:
• Species 1: T A C C | G G A T T A G T T A T G C C | G G A T C G
• Species 2: T A C G G A T G C C | G G A T C G G A A A T T C G
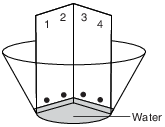
The diagram below represents the results of chromatography of leaf pigments from four plant species, A, B, C, and D.

Which plant species has pigments most similar to those in A? Support your answer using data from the chromatogram. [1]
Plant species: ________________________________
Allow 1 credit for indicating plant C and for supporting the answer. Acceptable responses include,
• but are not limited to:
• — A and C have the most bands in common.
• — A and C have the same pigments.
• — Only A and C have yellow, orange, and green.
• — The same pigments moved the same distance in A and C.
In the DNA Sequences chart, circle the number over each three-letter portion of the DNA that is different in humans and cows. [1]
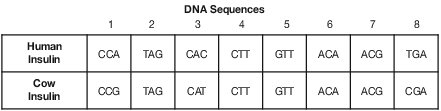
Allow 1 credit for circling 1, 3, and 8.
• Note: All three differences must be circled to receive credit. Allow credit if the student circled
• the correct DNA sequences rather than just the number.
An investigation was carried out on four different plant species to determine which of three species was most closely related to an unknown plant species. The results of the investigation are shown in the data table below.
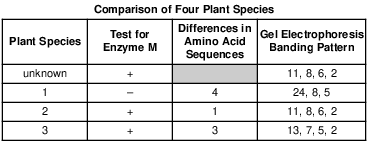
Which plant species appears to be most closely related to the unknown species? Support your answer. [1]
Species: ________________
Allow 1 credit for 2 and supporting the answer. Acceptable responses include, but are not limited to:
• — It has the most characteristics in common with the unknown species.
• — It has the same gel electrophoresis banding pattern.
• — It has only one amino acid sequence different from the unknown species.
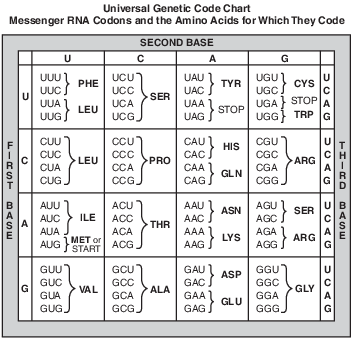
• In the table below, record the mRNA codons coded for by the DNA base sequences. [1]
• Then, using the Universal Genetic Code Chart, record the amino acid sequence that is coded for by the mRNA codons you placed in the table. [1]

The student’s response to the bulleted items in the question need not appear in the following order.
• 13 Allow 1 credit for recording the mRNA codons coded for by the DNA base sequences in the table.
• 14 Allow 1 credit for recording the amino acid sequence that is coded for by the mRNA codons in the
• table.
• Example of a 2-credit response for questions 13 and 14 :
• 
• Note: Allow credit for an amino acid sequence consistent with the student’s mRNA codons.
Several days after a litter of three purebred puppies was born, a breeder noticed one extra puppy in the litter. The diagram below shows the results of electrophoresis of DNA fragments from all of the dogs. The puppies are labeled 1, 2, 5, and 6. The parent dogs are labeled 3 and 4.
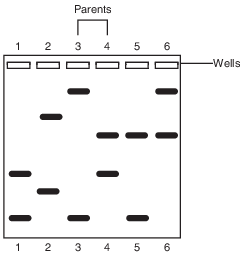
Identify which puppy might have been placed into this litter by mistake. Support your answer. [1]
Puppy: ____________
Allow 1 credit for 2 and supporting the answer. Acceptable responses include, but are not limited to:
• — It has no bands from either parent.
• — All of the puppies have bands from each parent, except for puppy 2.
• — It has bands not found in either parent dog.
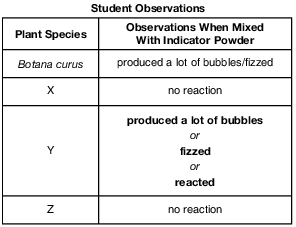
A student wished to determine the evolutionary relationships between three unidentified plant species (X, Y, and Z) and a known species Botana curus. Using an indicator powder to test for the presence of a specific chemical, the student made the observations shown in the data table below.
In the space provided in the data table, write an observation the student would expect to make if species Y were more closely related to Botana curus than it was to species X and Z. [1]
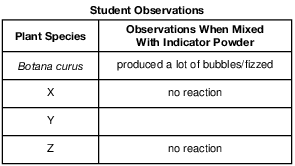
Allow 1 credit. Acceptable responses include, but are not limited to:
• Example of a 1-credit response:
•